What Have You Done For Me Lately?
I didn’t plan on writing about Nvidia this week, but the market forced the issue. Since NVDA is still one of the main bellwethers for the market, I thought I would review how its latest developments will affect its volatility.
As you may know by now, NVDA’s Q2 earnings release last Wednesday easily exceeded expectations. The company delivered its usual combination of spectacular year-over-year results: revenue, up 122%; net income, up 168%; and profit margin, 55%, up from 46% in the previous year.
Given their super optimistic expectations, that just wasn’t good enough for Wall St., which sold NVDA off 6.4% after the announcement. It seems that investors are becoming increasingly convinced that AI Fest ’24 is running out of steam and that Nvidia’s spectacular revenue and earnings growth must taper off, eventually. The company’s sales guidance for Q3, which beats analysts’ forecasts but not by enough to truly impress, seemed to confirm this. And most important, they are worried about whether Nvidia’s chips can actually make money for their customers in the real world (shouldn’t they have been concerned about that from the very beginning?). Regardless, “what have you done for me lately?”, the anthem of every horrible boss, comes to mind.
Somewhat under the radar was the announcement of a $50 billion increase in its share buyback authorization, up from the existing $7.5 billion remaining on its existing authorization. Depending on the company’s strategy, they could use that as a quasi-put to support the stock price (similar to Cheniere Energy, which I discussed previously in LNG: Disconnected?)
Regardless, apparently the NVDA skeptics have gained the upper hand, aided by weakness in other sectors and the broad market. The stock came off a steep 9.5% on Tuesday, resulting in the single largest decline in the company’s market capitalization since it went public in 1999.
Although it was certainly a whopping down day, it wasn’t even close to the largest single day percentage price decline the company has ever seen, that being -35.2% on 08/06/2004. After ranking all the negative days since 1999, yesterday comes in at only 59th. Since NVDA started rallying in early 2003, the largest single day drop was 10%. Yesterday’s move was certainly steep, but it wasn’t unprecedented.
From an implied volatility perspective, yesterday’s price action was large enough to cause an almost 8 vol point increase, ending the day at 54.2% (30-Day, put and call average) from 46.4% the previous day (see chart below). NVDA’s usual vol crush pattern, which had resulted in an almost 25 vol point decline in implied volatility since the earnings announcement, was interrupted. If NVDA continues to spiral downwards, then its implied volatility will increase; otherwise, it will consolidate in the +/-50% region.
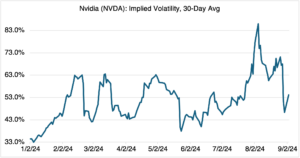
Source: OptionMetrics
Interestingly, since the beginning of August, NVDA’s risk premium, i.e., in this case its 30-day implied volatility – 30-day historical (realized) volatility, turned sharply negative and is on the extreme left side of its 2024 distribution (see charts below).
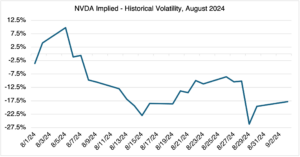
Source: OptionMetrics
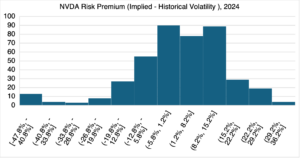
Source: OptionMetrics
I only mention this because the values are unusual. Some investors use the risk premium to try to predict implied volatility. After all, if realized volatility varies from implied volatility, shouldn’t the latter be considered over or undervalued? Not necessarily, and most of the time not. Why? Realized (historical) volatility looks backwards in time and implied volatility looks forward. As such, implied contains an uncertainty factor that historical does not. Simply, the two volatility metrics are measuring different things. They are related, and you can tell from history when the spread between the two is historically high or low, but in my experience it’s of limited use in trying to predict implied volatility.