Visual Greeks and LNG
When I first started trading options, valuation and analytical support were extremely limited. I had nothing even approaching the usefulness of OptionStrat.
Let’s take just one feature, Visual Greeks, and how it can help analyze options on a stock I reviewed just last week (With Enough Money), Cheniere Energy (LNG). Visual greeks are a new feature in our options profit calculator tool that expand it’s capabilities from predicting the future profit and loss to prediciting the future greeks. Just as our calculator can show you how your profit is expected to change as time progresses and the underlying stock moves, you can now see the same for greeks in a way that you have probably never considered before.
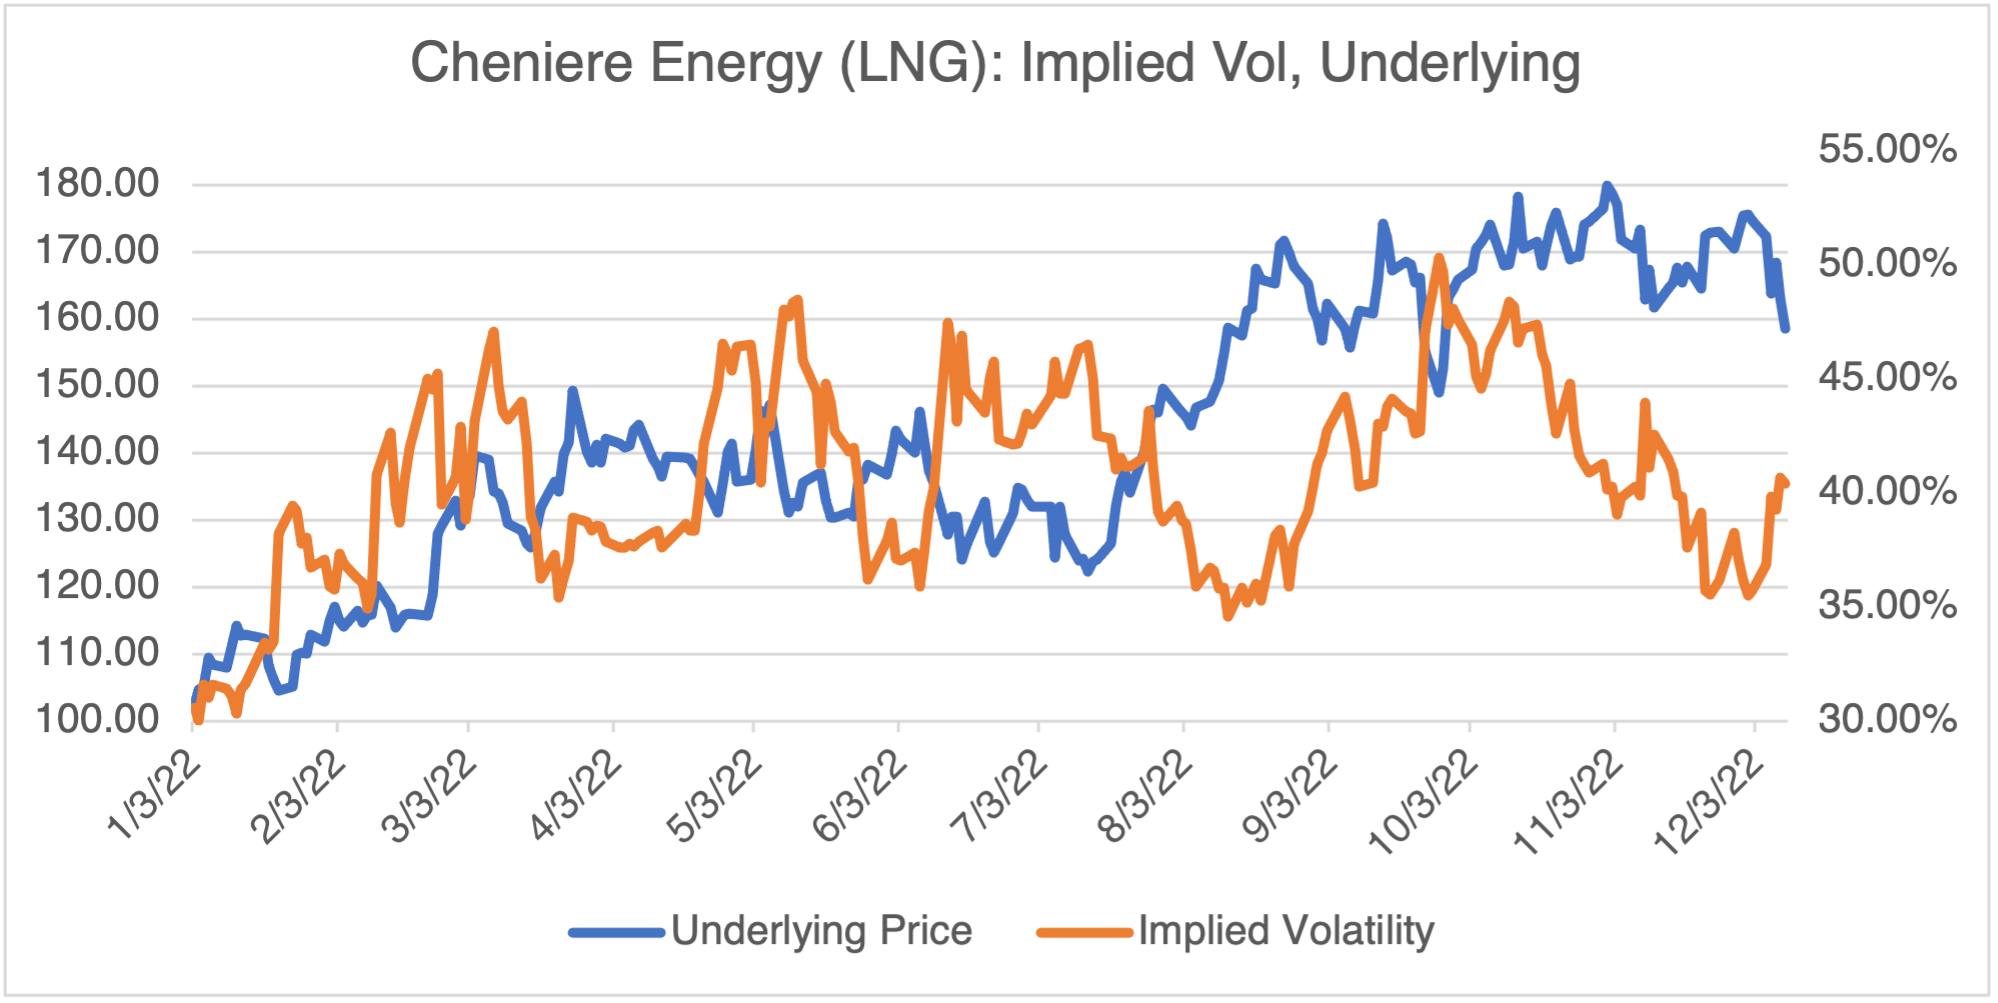
(Source: Historical Options & Volatility Data by OptionMetrics)
As I wrote, “In the short term, Cheniere has been responding to developments in the European energy situation and recent events have not buoyed the stock. Against all odds, Europe managed to fill their natural gas stocks to over 90% by November and the continent has had a mild winter (so far). However, those are short term factors. In the long term, LNG is now a viable and established energy source for Europe and is here to stay. If you believe this, then Cheniere is a direct way to express the long-term investment thesis.”
There are two ways to play Cheniere, short and long term. If you believe that the mild European winter has relieved their energy crisis, then it follows that LNG might break out to the downside of its $148.95 (09/26/22) – $179.86 (11/01/22) range that’s been in place since last summer. In that case, uncertainty regarding the stock’s future price direction will likely also increase, driving implied volatility higher. If both of those events occur, then there’s no reason to get too fancy — a simple long put position will suffice.
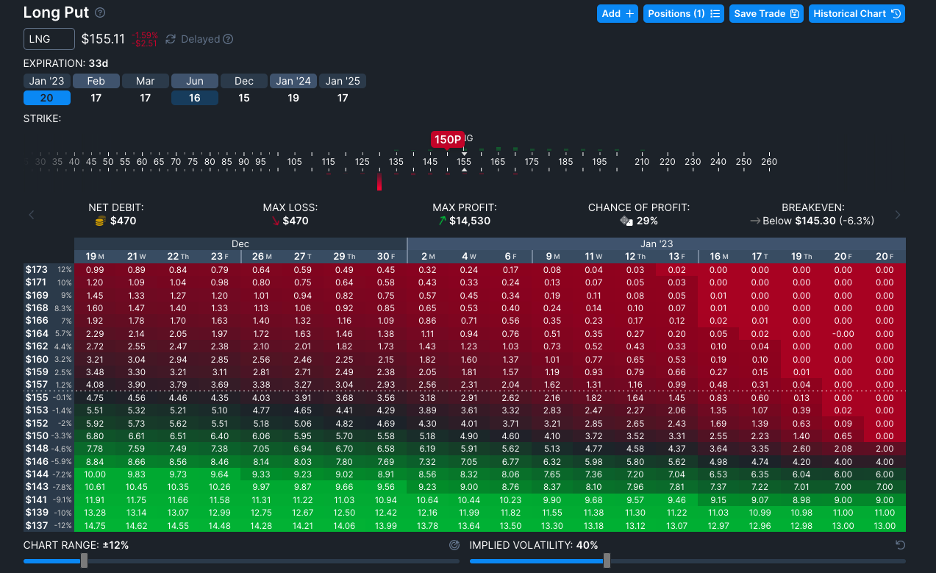
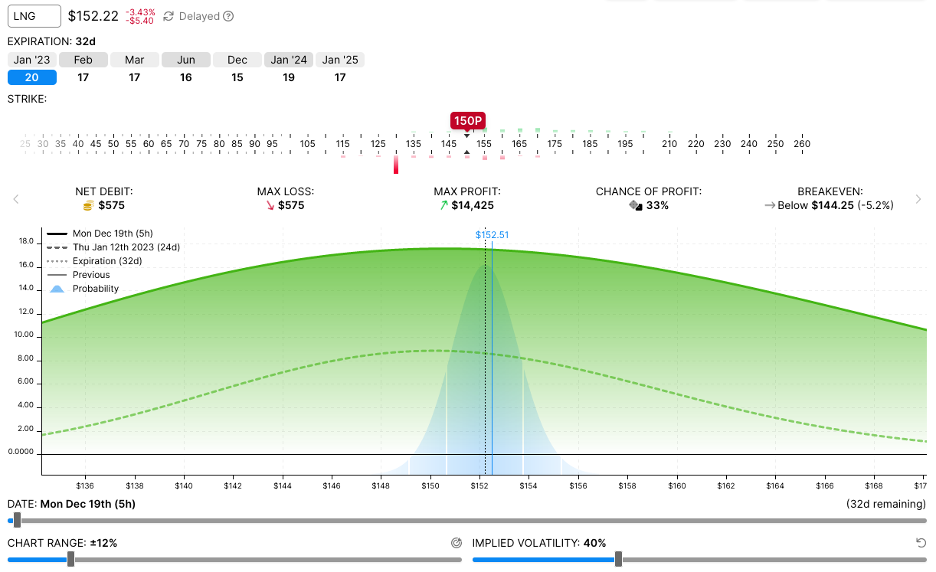
Using OptionStrat, let’s consider the Jan ’23 $150 put:
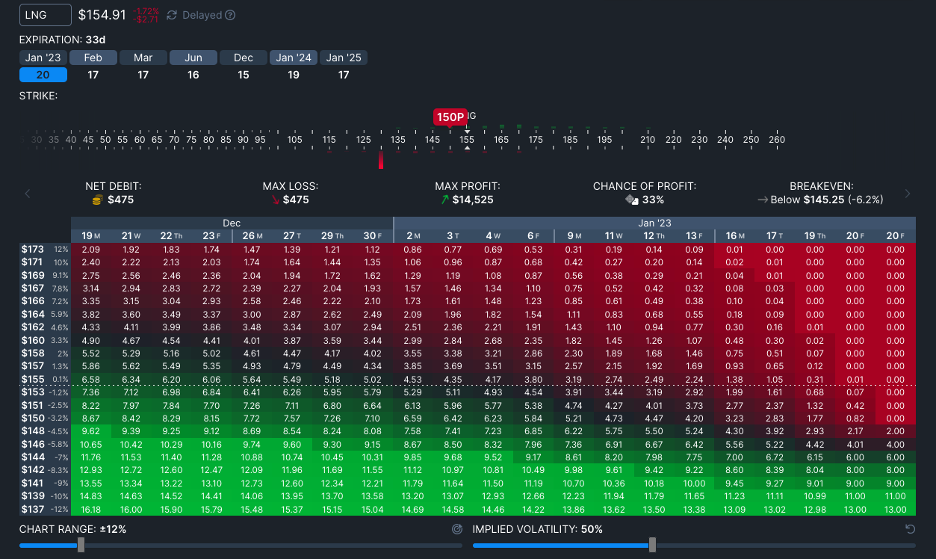
Below is the same $150 put with implied volatility 10 points higher at 50% (below). Valued with the underlying at $155, you can see that the premium increased from $4.75 to $6.58, or $1.83.
In this case, I used the slider to increase IV. I also could have estimated it quickly by using the option’s vega. All the Greeks may be obtained by simply highlighting 150P on the display above.
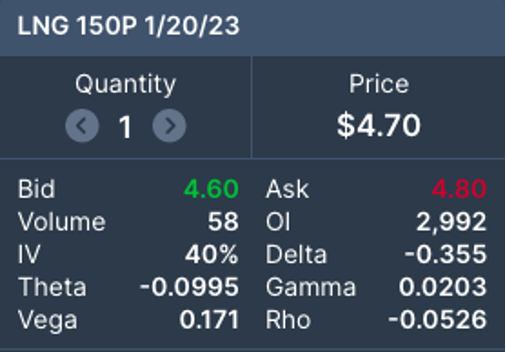
The $150 put’s vega (the change in premium for every 1% change in implied volatility) is shown as 0.171; a 10% move in implied volatility would therefore be $1.71, very close to the $1.83 obtained by moving the volatility slider. Also note that the option’s theta, or daily time decay, is about 0.10/day with 32 days to expiration as of 12/19.
It’s important to understand that option greeks are not static but vary as the underlying and time to expiration change. Consider the examples below:
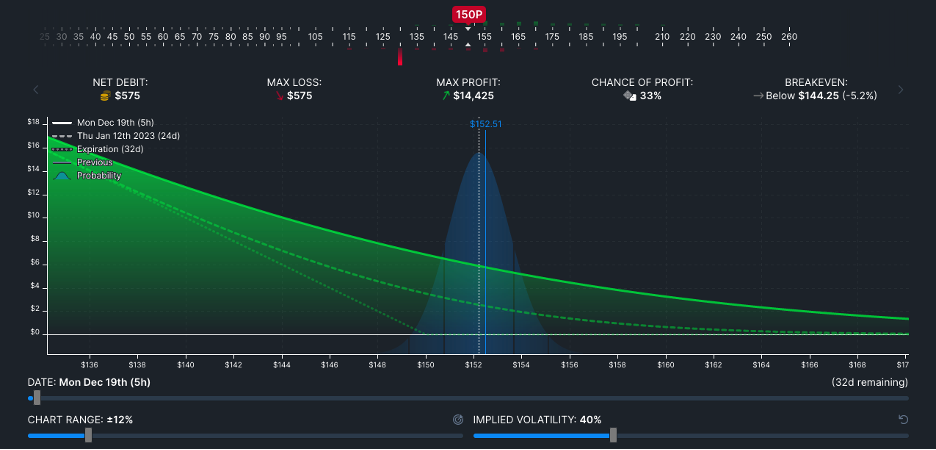
Vega:
Theta:
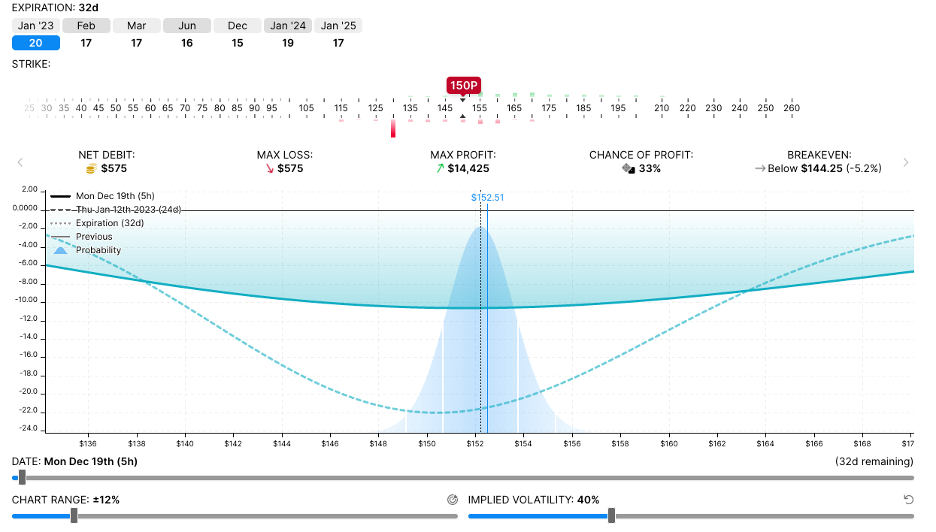
In both cases, you can see that theta and vega are maximized when the underlying remains close to the strike. Why? Think of it this way. An options price is a reflection of the uncertainty about where the stock will close at expiration. Time and volatility affect the options price since they affect that uncertainty. For example, if an option has a long time to go before expiration, or is very volatile, then it is more difficult to determine where it will eventually be at expiration. That uncertainty is greatest when the stock is trading close to the strike and has a 50/50 shot of expiring in or out of the money. Hence, theta and vega are maximized.
I would be remiss if I didn’t point out one of the classic rookie errors in options. 99.99% of the time, strategy P/L charts are shown at expiration, not before. As you can see above for the LNG long put position, P/L shapes evolve over time as time value changes. If your actual and day-to-day P/L results don’t match up with the chart, that’s probably why.
The examples above are meant to demonstrate the effect of the Greeks on a specific strategy, in this case the January $150 put on Cheniere. Of course, you may disagree on Cheniere’s outlook. Since LNG has been in a trading range since last summer, you may conclude that the stock is just trading near the lower end of the range and will recover. In that case, strategies that are short theta (i.e., profit from time decay) and short implied volatility will be more to your liking, such as short straddles or strangles. Although appealing in concept, both are difficult to execute profitably in the real world. More on these next week.