Vol Crush, Again and Again
Some popularly watched stocks issued their earnings reports last week, and I thought I would look into whether they experienced vol crush before and after the fact. I reviewed 10 stocks: AXON, FTNT, KTOS, MELI, SHOP, UBER, ANET, APP, COIN, and VRTX.
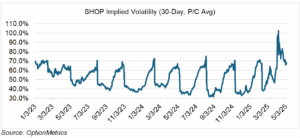
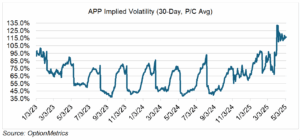
Sure enough, 8 out of the 10 experienced significant vol crush. COIN and VRTX were the only exceptions. As you can see from just the two examples below, SHOP and APP, their implied volatility increases before earnings announcements and then plummets afterwards (vol crush). The pattern is regular and consistent:


Since implied volatility (IV) is proportional to an option’s premium, a significant decline or increase in implied volatility over the course of a few days will have a major impact on option prices. For example, a 40% decline in IV (which was indeed the case for several instances above) will decrease an option’s premium by almost 40% (not exactly, but close (within a few percentage points) and with all other inputs — price, time, interest rates — being held equal). In some cases, that would be large enough to counter the effect from any price-related move. Significant and sudden moves in implied volatility, such as those that could occur during vol crush, could lead to some interesting situations. For example, given a large enough decrease in implied volatility, call premiums could actually decrease as the underlying increases. For options traders, that’s a very big deal, and something to take advantage of.
As I’ve written before, vol crush is a dependable and consistent strategy and a way to play the options market without having in-depth opinions on price direction. Implied volatility is the thing, and it’s a trade only open to options traders.
The Tyranny of Mark-to-Market
The first thing I ever traded was foreign exchange futures. Historically dominated by direct transactions between banks (conducted over the phone), FX futures had just started trading and I was elected to deal with them. Over-the-counter options soon followed and exploded in popularity.
At the end of the trading day, someone from the back office would come into the trading room and discuss the daily marks with me. Valuing futures was easy – every day, there is a legal price settlement at which each contract is valued. On the other hand, since over-the-counter instruments usually include customized terms and can be very one-off, and very illiquid, valuing them accurately and consistently was always a challenge and sometimes subjective.
Which brings me to the street’s latest attempt to wring some return out of a difficult market, alternative investments, sometimes known as private assets. What are they? It’s a pretty broad category, but they include shares in everything from hedge funds, private equity, and venture capital to art and collectibles (cars, baseball cards, whatever). Basically, anything that is limited in distribution and too expensive for most to afford.
Exclusivity sells, and investment advisors are into it. Invest in boring old indexes or ETFs? Doctors and dentists do that — boring!! Forget all that — you too can invest in hedge funds, or cutting edge art, or Ferraris, just like the cool kids! Uncorrelated and high returns! Who can say no?
Like all things that seem too good to be true, it’s not, and for a few reasons that have more to do with common sense than any special knowledge. First, expense loads for alternatives are usually very high. Second, they can be illiquid, as in you can’t just sell them whenever you want. To add insult to injury, sometimes they charge redemption fees as well. Lastly, and perhaps the most interesting, is that their risk metrics, including correlation statistics, are most likely understated.
To understand why, the seemingly esoteric issues of mark-to-market valuation becomes important. Alternative investments usually only issue valuations on a monthly or quarterly basis, not daily. As a result, you could be in the dark about the fund’s most current valuation, as well as its correlation to other assets. That doesn’t reduce its volatility, nor make it uncorrelated, just opaque and difficult to assess. And finally, the valuation methodology itself may be flawed. For example, spreads in illiquid assets are notoriously wide. Is the valuation taking this into account? And is the methodology consistent across periods?
All this should lead to one conclusion: stick with what you know, stick with liquid instruments that can be valued easily, and stick with daily valuation. Anything else is asking for trouble.