Trees Don’t Grow to the Sky!
Last week, I attended a derivatives conference in Las Vegas (Quants in Vegas, an interesting combination). Like all conferences, it was a chance to see and be seen and to check out what everybody else is thinking. After just a few presentations, a common theme emerged: deep, unrelenting, and pervasive bearishness. Whatever the cause — inflation, the Ukrainian war, the Fed, interest rates, supply disruptions, China, commodity super cycles, or a return to 70’s style stagflation — the conclusion was always the same: the market is very bearish and very likely to get worse. After a few hours of listening to this, buying the giant bag of rice at Costco seemed like a good idea.
As much as I would love to discount the speakers’ super bearish warnings, these guys aren’t amateurs and have been around for some time. Inflation continues to rage at levels we haven’t seen since the 70s; the unending Ukrainian war is causing a supply side shock to energy prices; China continues to threaten Taiwan; and a recession is possibly looming. The NYT even had a story about rogue asteroids! All of these are perfectly valid concerns, and when considered against a backdrop of political division and rancor, I can understand all the doom and gloom out there.
Still, the old market aphorism “trees don’t grow to the sky” came to mind, i.e., trends don’t go on forever, especially when everyone is in universal agreement.
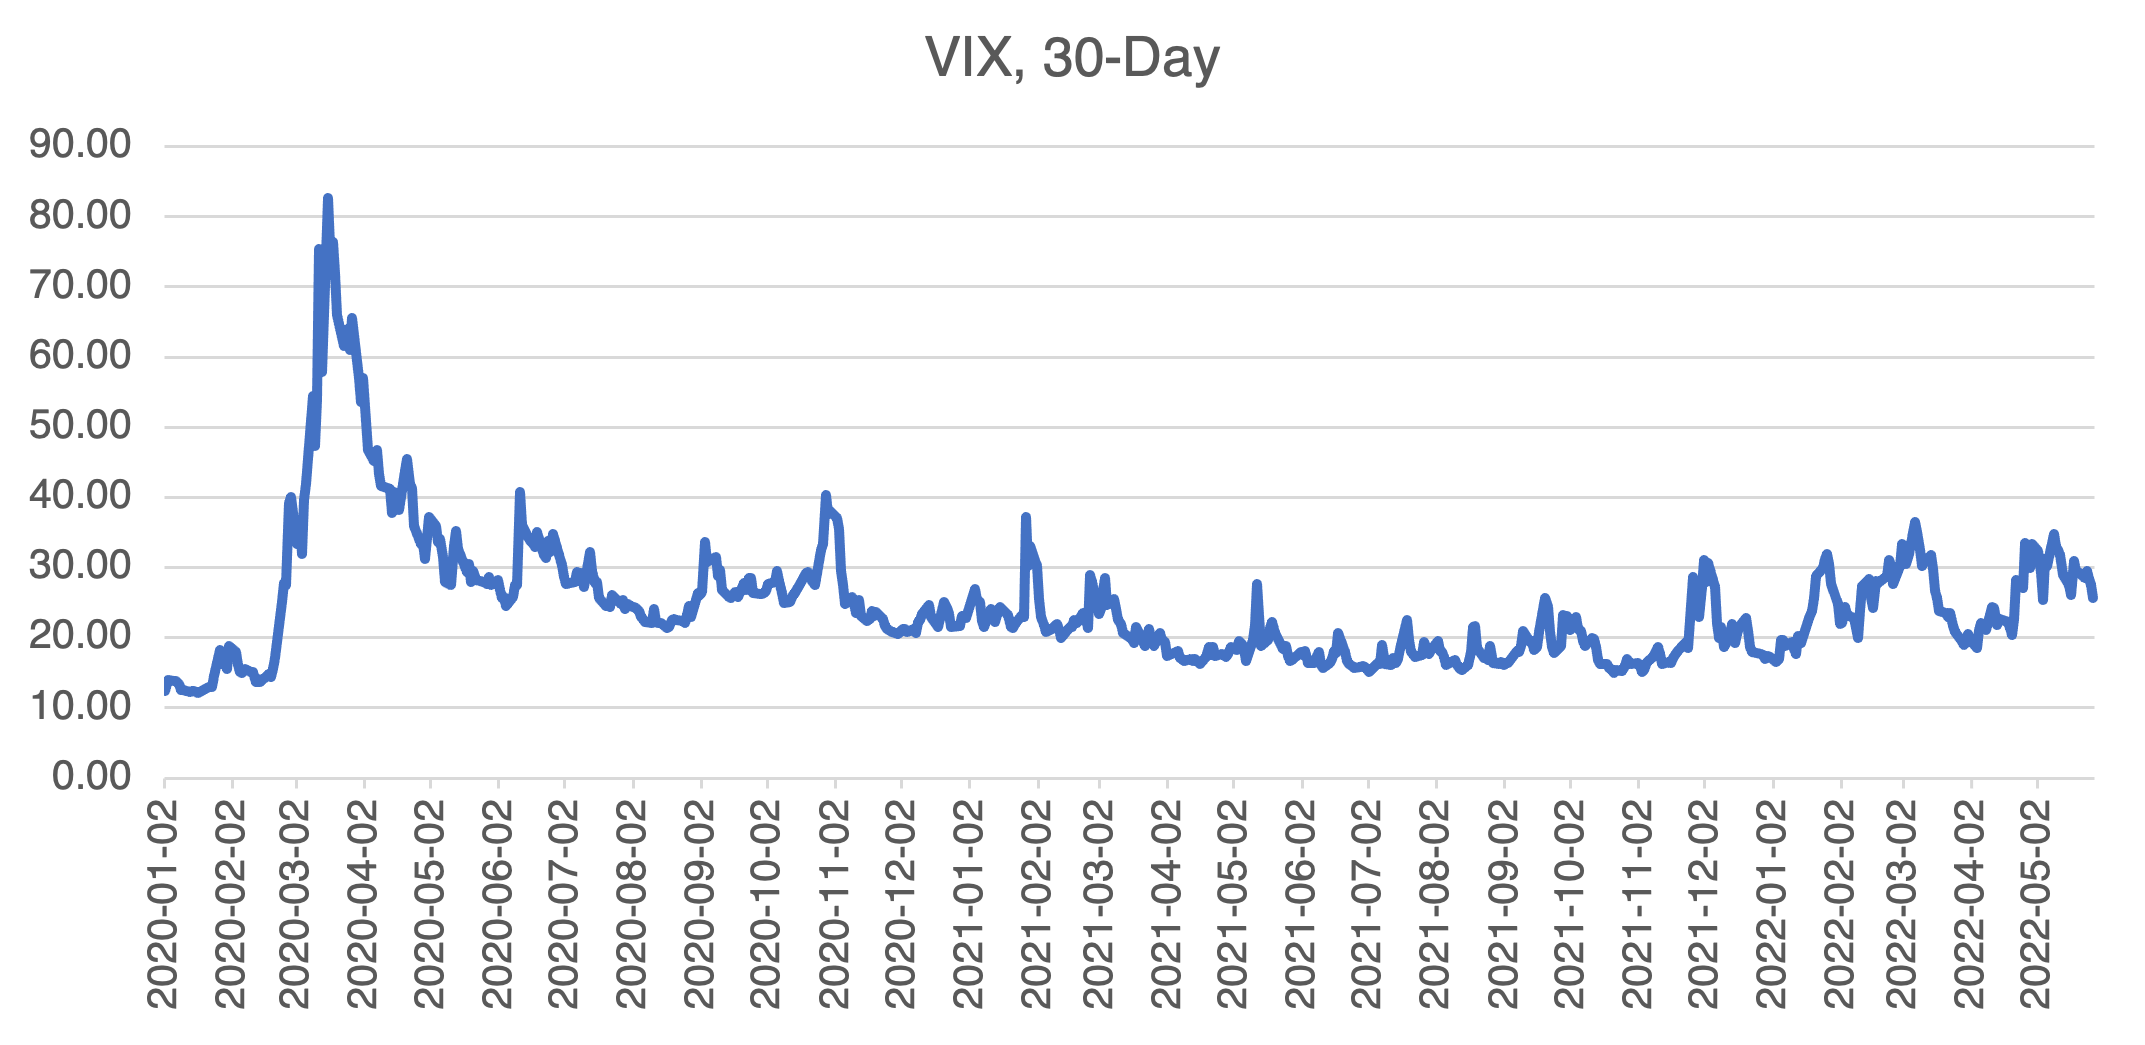
Given all the pessimism out there, one would expect volatility to be high and at the levels of previous sharp bear markets. This would be consistently over about 30 for the VIX and SPIKES indexes. This is not the case , and it’s not even close. As you can see below, the VIX maxed out at over 80 during the start of Covid and reached similar levels during the financial crisis. Currently, it has a hard time getting over 35.
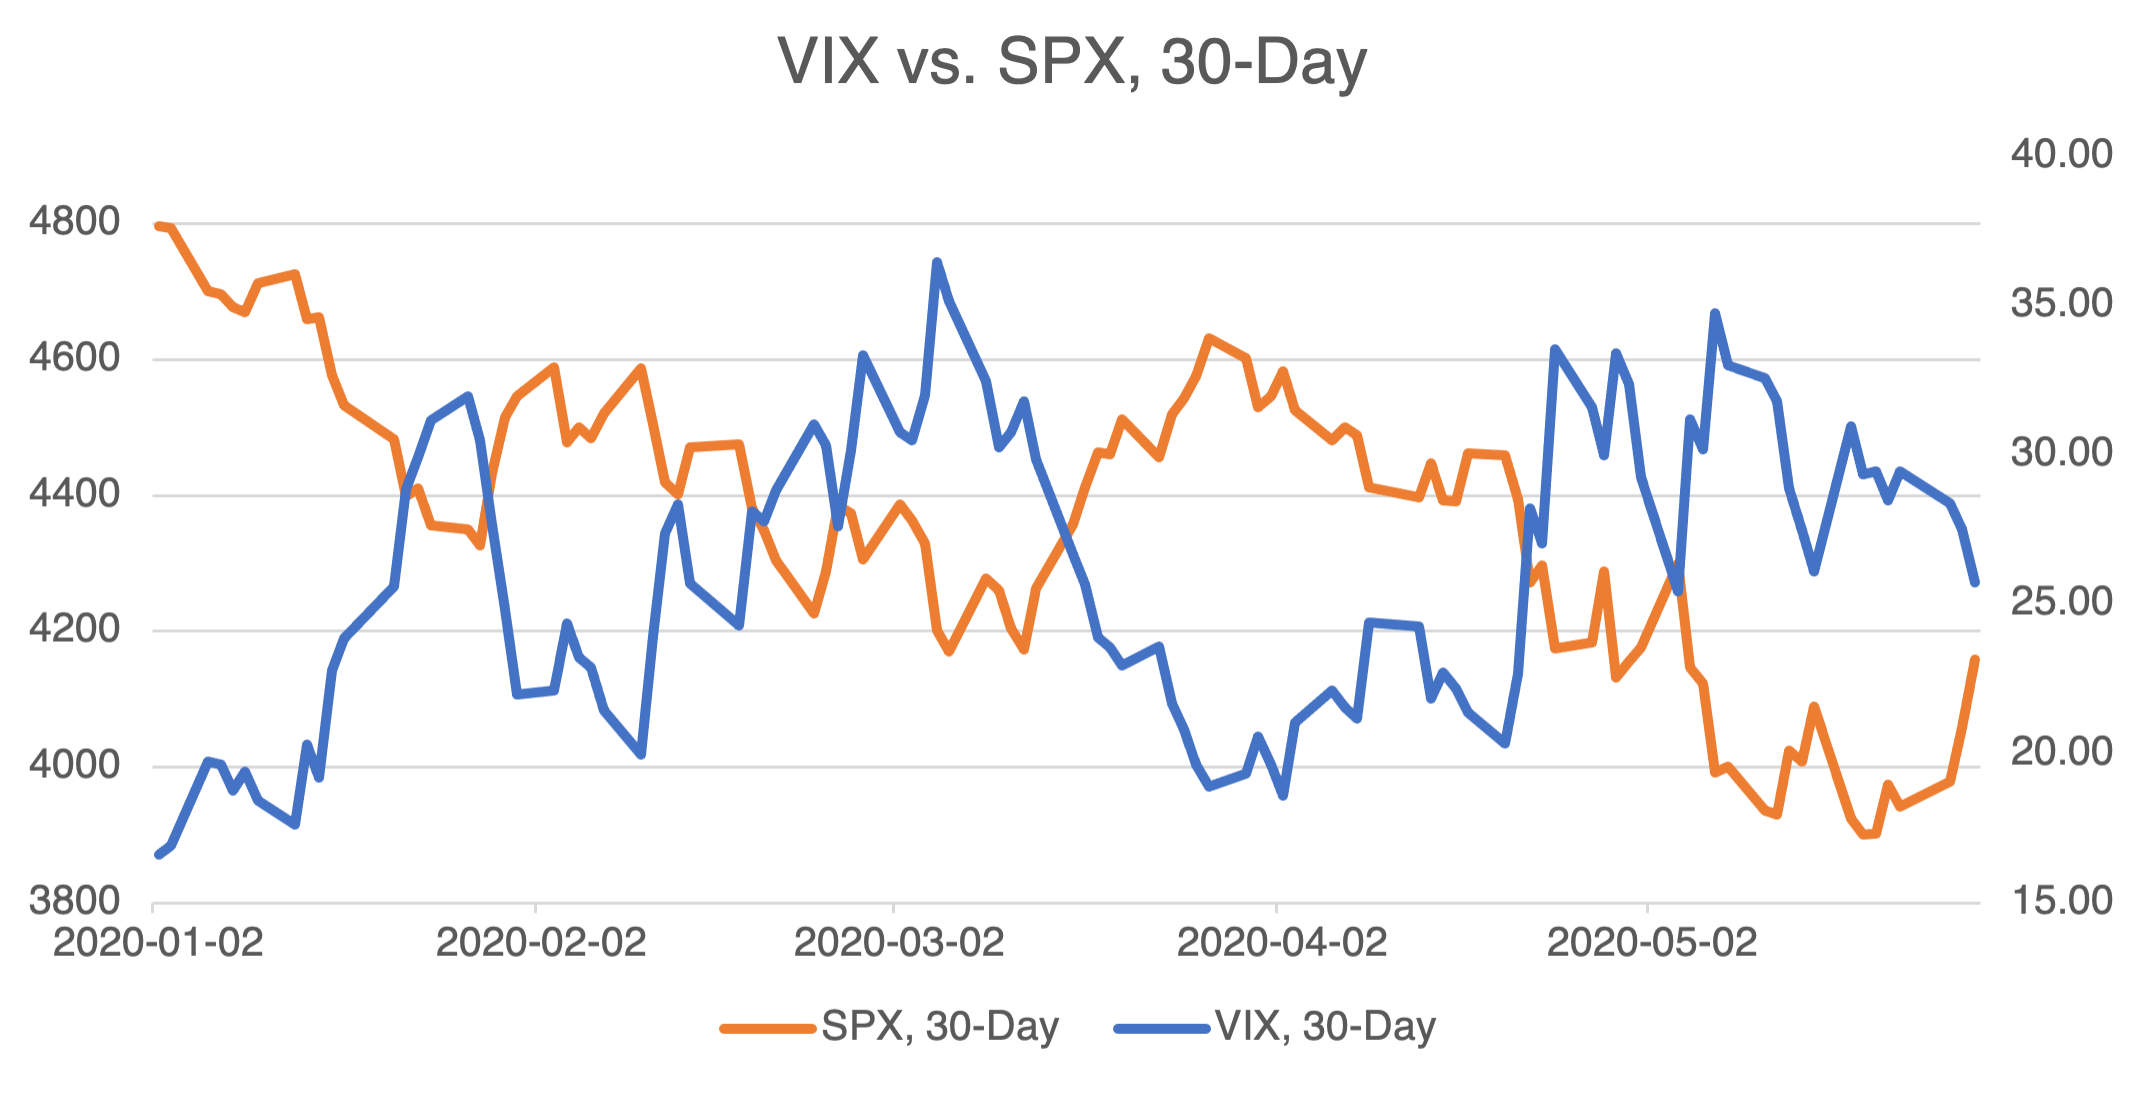
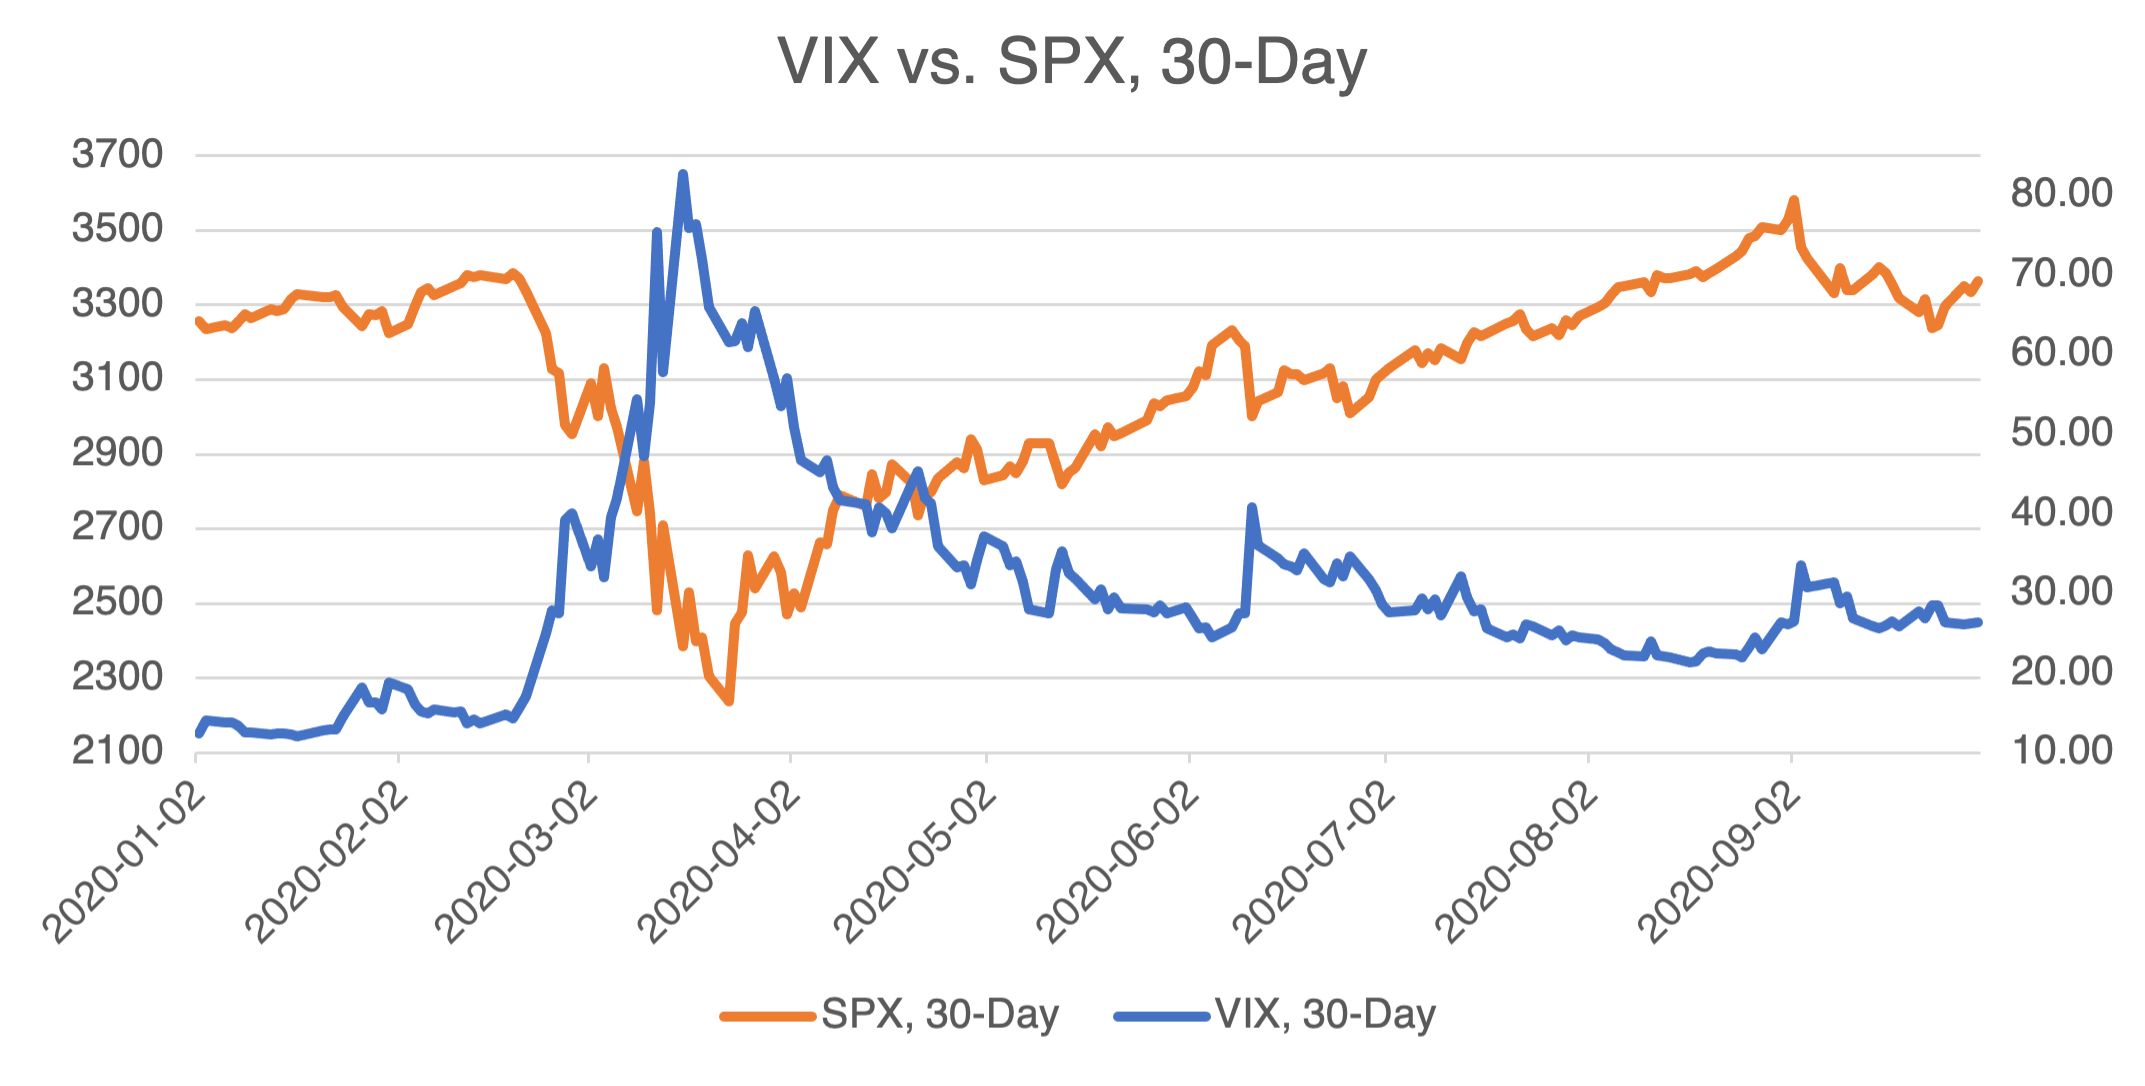
After reviewing the two charts above, you can understand the popular aphorism, “When the VIX is high, it’s time to buy. When the VIX is low, look out below!” Translation: the VIX can be considered a contrary indicator and usually rises during bear markets and comes off when the market is going sideways or rallying.
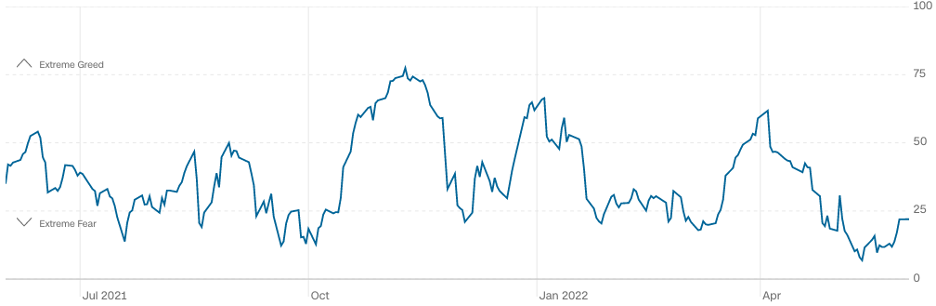
Other fear and greed indexes attempt to quantify sentiment and are also considered to be contrary indicators, i.e., when they are at extreme levels, the market tends to go in the opposite direction. One of the most popular, the CNN Fear and Greed Index, uses seven different factors to get a reading between 0 (extreme fear) and 7 (extreme greed). As of May 30th, it was at 21, indicating “extreme fear.” The American Association of Individual Investors’ weekly survey is another such indicator and asks individual investors their thoughts on where the market is heading in the next six months. As of May 25th, bearish sentiment was at 53.5%, high but below its one year high of 59.4% recorded in late April.
CNN Fear and Greed Index:
(Source: CNN)
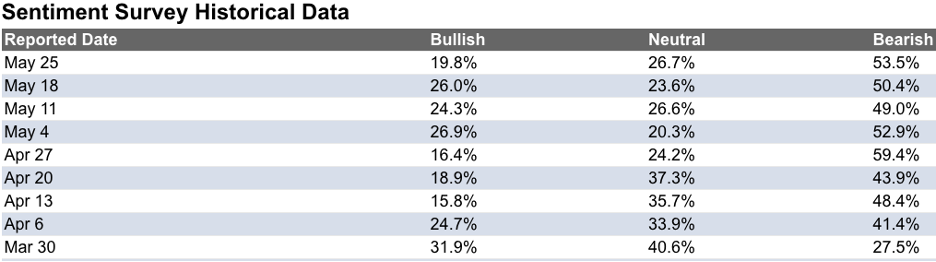
(Source: American Association of Individual Investors)
All sentiment indicators are usually “sticky” in that the market doesn’t react immediately to their signals. For that reason, they are better for confirmation of market direction or warning signs than to initiate new positions.
What does all this mean for the market right now? In short, the VIX and sentiment indicators suggest that the steep bear market may be delayed for the time being until new negative information comes to light. What that is, nobody knows, but there is certainly no surfeit of bad news available.