Trading the Calendar: Does it Work?
Can you predict future price movement based on the time of the year or political events? From reading the financial press, it would seem you can.
There are a few trading strategies tied to the calendar. Using SPX data going back to 1996, let’s see if the data proves any of the purported results.
A. The Santa Claus Rally. The last five trading days of December and the first two trading days of January are said to have higher returns than other times during the year. Our data indicates that this is true: the average daily return during the period (0.136%), was indeed higher than the rest of the year, (0.029).
B. The Presidential Cycle. Returns are ranked by each year in a president’s term. The first year is purported to dip, the second year to be the weakest, the third year to be the strongest, and the fourth year varies. Examining SPX returns since the 1996 election cycle, the record seems to be varied, at best. The strategy is unsupported by the data. Apparently, although some of the factors influencing each President’s economic record, such as the timing of policy changes and mid-term elections, are consistent over time, other outside factors are more important.
C. Sell in May and Go Away (also known as the Halloween Indicator). The theory is that the period from May to October has lower returns than the other months in the year. The strategy would then be to convert into cash in May and then reinvest in October. The data seems to support this: average daily returns for the period from May – October were 0.0256%; for the entire year, 0.0392%. Sell in May and Go Away seems to be true, although its practicality is questionable if you have anything more than a few indexes in your portfolio.
D. October Surprise. Declines and crashes are more likely to occur in October than other months. That would imply that volatility would be the highest during the month. Using VIX data, this is true: on average, October has the highest VIX values, with March and November a close second and third. Q4 is the most volatile quarter, although Q1 is close.

E. Summer Doldrums. July is the low point for the VIX. Referring to the same VIX data and results as the October Surprise strategy, this is true: the VIX does bottom out in July. More generally, Q3 had the lowest readings.
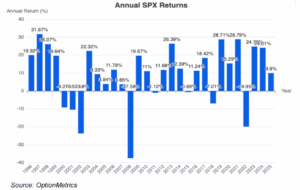
One interesting side note for all of those you who think that the VIX is abnormally low this year. Below is a bar chart of the average yearly VIX since 1996. The average level so far this year, 20.43, is a little higher than the long-term average, 20.19. Since 1996, only 13 years out of the 30 in the series had a higher average. In addition, this year’s highest settlement, 52.33, was higher than only three years in the period (2008, 2009, and 2020). This is not an extraordinary year when it comes to the VIX, at least so far.