The VIX is Pumped
Many options traders try to assess implied volatility by examining historical realized volatility and the spread between the two. It’s a tricky business since they are not exactly the same thing — implied is forward looking and historical looks only backwards. But despite its drawbacks, occasionally the spread, known as the volatility risk premium (VRP), can produce some useful insights.
Currently, and despite the uncertainty as a consequence from the war in Iran, the VIX is trading at relatively moderate levels, mostly due to a buoyant S&P. Let’s see what’s going on and if the VRP can help.
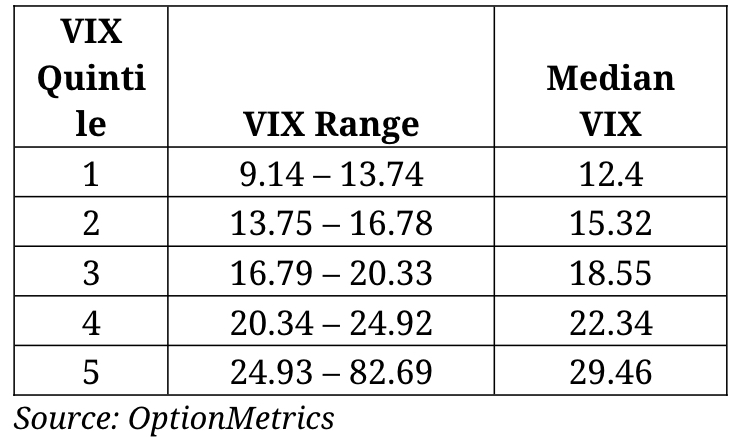
Below is the VIX since 1996 broken down into quintiles:
If you have historical SPX data, it’s pretty easy to calculate the volatility risk premium (VRP). Simply, it’s implied volatility – historical (realized) volatility. You can use the VIX index as the implied volatility component. Historical volatility is the 20-day standard deviation of SPX daily returns, annualized (multiply by the square root of 252, roughly 16). Typically, 20 days are used; you can choose any duration you please, but keep in mind that longer periods reduce its sensitivity. Since implied volatility is forward looking and therefore contains an uncertainty factor, the VRP is usually higher than historical.
Since a moving average of the last 20 days of returns goes into the standard deviation calculation, historical volatility is slower to react than implied. The result is that during periods of extreme stress, at first implied volatility outruns historical volatility and the VRP spread widens rapidly. After a few days, extreme returns increase the standard deviation and historical volatility increases, narrowing the VRP. By that time, often the VIX has peaked and has begun moving back into more “normal” territory. Negative VRPs can result.
Below are the VIX quintiles and the median VRP since 1996:
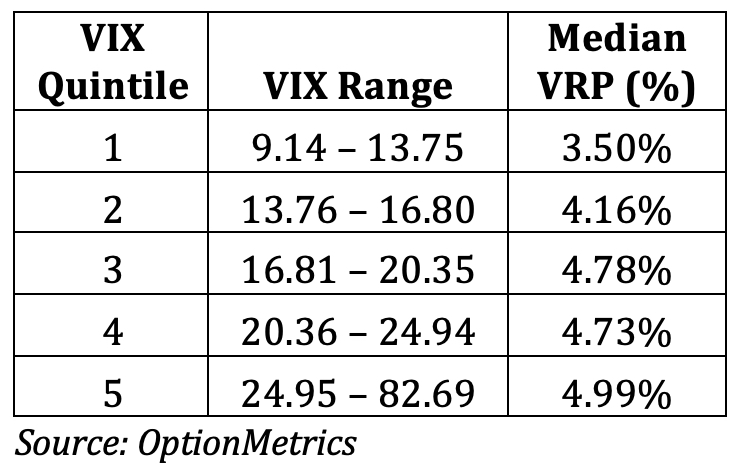
The VIX rallied on Monday, 05/11) to 18.38 but still remains in the third quintile. The current VRP at 7.90 (05/11/2026) is higher than the 4.78 median for that quintile, indicating that the VIX may be undervalued.
Shown another way, below are the VRP quintiles and the median VIX associated with each:
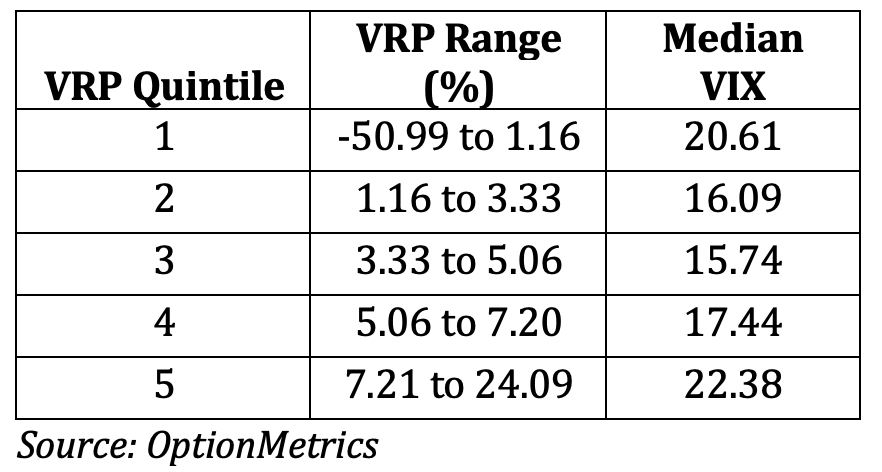
As you can see, the current VRP of 7.90 is associated with a median VIX of 22.38, which is considerably higher than its current reading of 18.38 (05/11/2026).
In other words, traders are paying up for downside protection as the Iran conflict raises tail-risk odds for the S&P 500. This is lifting the volatility risk premium and, if it persists, could pull the VIX higher toward the median level implied by today’s VRP.