The VIX and the Election: They Never Learn!
As you probably know, the VIX is popularly understood as the markets’ fear or uncertainty index. Given the heated rhetoric surrounding the election and all the predictions of doom and gloom, I thought it would be a good time to review the VIX and some of the ways in which it may be misunderstood.
First, the VIX index is a measure of the S&P 500’s expected volatility over the next 30 days. The index is calculated by using the implied volatilities of SPX put and call and options with expirations between 23 and 37 days away and then interpolating between them to arrive at a constant 30-day expiration. Therefore, it will not react (most of the time), as it were calculated from a series of 0DTE options. The VIX was never designed to be a short-term volatility indicator. As far as the VIX is concerned, not all events are created equal.
Second, keep in mind that it takes a lot for the VIX to move significantly on an absolute basis. As a matter of fact, elevated levels are pretty rare (see the table and chart below) and usually set off by events straight out of left field, e.g., wars, pandemics, or sudden and unpredicted policy shifts. “Unexpected,” “sudden,” or “unpredicted” are the key words here. A major divergence from consensus opinion can also get the VIX to jump, such as unexpected corporate results or Fed policy shifts.
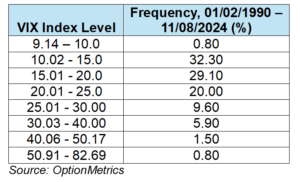
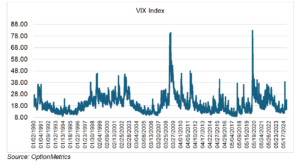
Given all that, why do traders continue to look for a big score in the VIX? It’s not totally irrational. First, moves greater than or less than 10% have occurred almost 10.50% of the time since 01/02/1990. And second, the right return tail shows more extreme results than the left (see chart below):
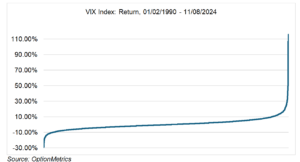
If you view it as a lottery ticket with a chance to score big to the upside, the return profile makes more sense. But, it’s a tricky trade that requires excellent timing. For VIX bulls,
getting the VIX to stay at elevated levels for more than just a few days can be a very disappointing exercise. For example, of the 8,796 days in the sample, only 73 were above 50.91 (0.83%), and that was during the two most significant market events of the last few decades, the 2008 financial crisis and the pandemic.
Two comments: 1) if you’re expecting a giant jump in the VIX, curb your enthusiasm—it doesn’t happen that often; 2) if it does happen to jump and the end of the world isn’t very apparent, take profit quickly because the VIX is likely to run out of gas.
The most recent election was a great example of both, albeit on a miniature scale. On the day before the election, the VIX closed at 21.88, and had closed over 20 for every trading day in November. The index was signaling the uncertainty and anxiety arising from a super close race and the possibility that the winner might take days to even weeks to emerge or might even be determined in court. At the same time, all of this was very well known and discussed endlessly in the media; the potential uncertainty factor was therefore low and kept in check, limiting the VIX to the low 20s and not higher.
By now, we all know what happened after the election. The VIX behaved perfectly to form. The election was over, one side won convincingly, the other side conceded, and there was nothing to contest. The prop holding the VIX to over 20 was kicked out, and it crashed 4.22 points to 16.27, or a whopping 20.6% lower, the day after the election. No uncertainty, no volatility, and more disappointed VIX bulls.
Prediction Markets Aren’t Perfect After All!
As I mentioned in a previous blog, Prediction Markets: Who Knows?, the four main prediction markets were showing Trump the clear favorite since early October. Although the Trump margin tightened up somewhat in the days before the election, all four markets flipped to 80/20 Trump as soon as early returns started flowing in:
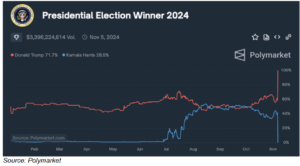
Obviously, the prediction markets turned out to be right, and the polls were very much wrong (again). Polymarket, Kalshi, Predictit, and ForecastEx are all suddenly very much in vogue.
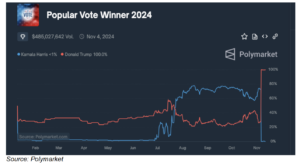
But were they really correct? As you can see below, the prediction markets’ results for the popular vote winner were consistently incorrect right up to the day before the election. (I’m showing Polymarket, but the others were very similar.)
So, apparently, prediction markets aren’t that foolproof after all!
A Crazy Statistic
46% of electric vehicles have negative equity, i.e., borrowers owe more on their cars than they are worth. For all vehicles, it was running 24.2% as of the end of Q3 2024. That’s almost a 22-point spread. Considering EVs were widely predicted to be the wave of the future just two short years ago, and buyers were lining up to pay over sticker for them, that’s pretty surprising.