Straddlers Beware
Last week, I demonstrated the Visual Greeks feature of OptionStrat using Cheniere Energy (LNG) as an example. The visual greeks feature is a new addition to our options profit calculator that makes it easy to see how the greeks evolve over time, something you probably haven’t considered before. To refresh your memory, below is LNG’s price and volatility action for 2022.
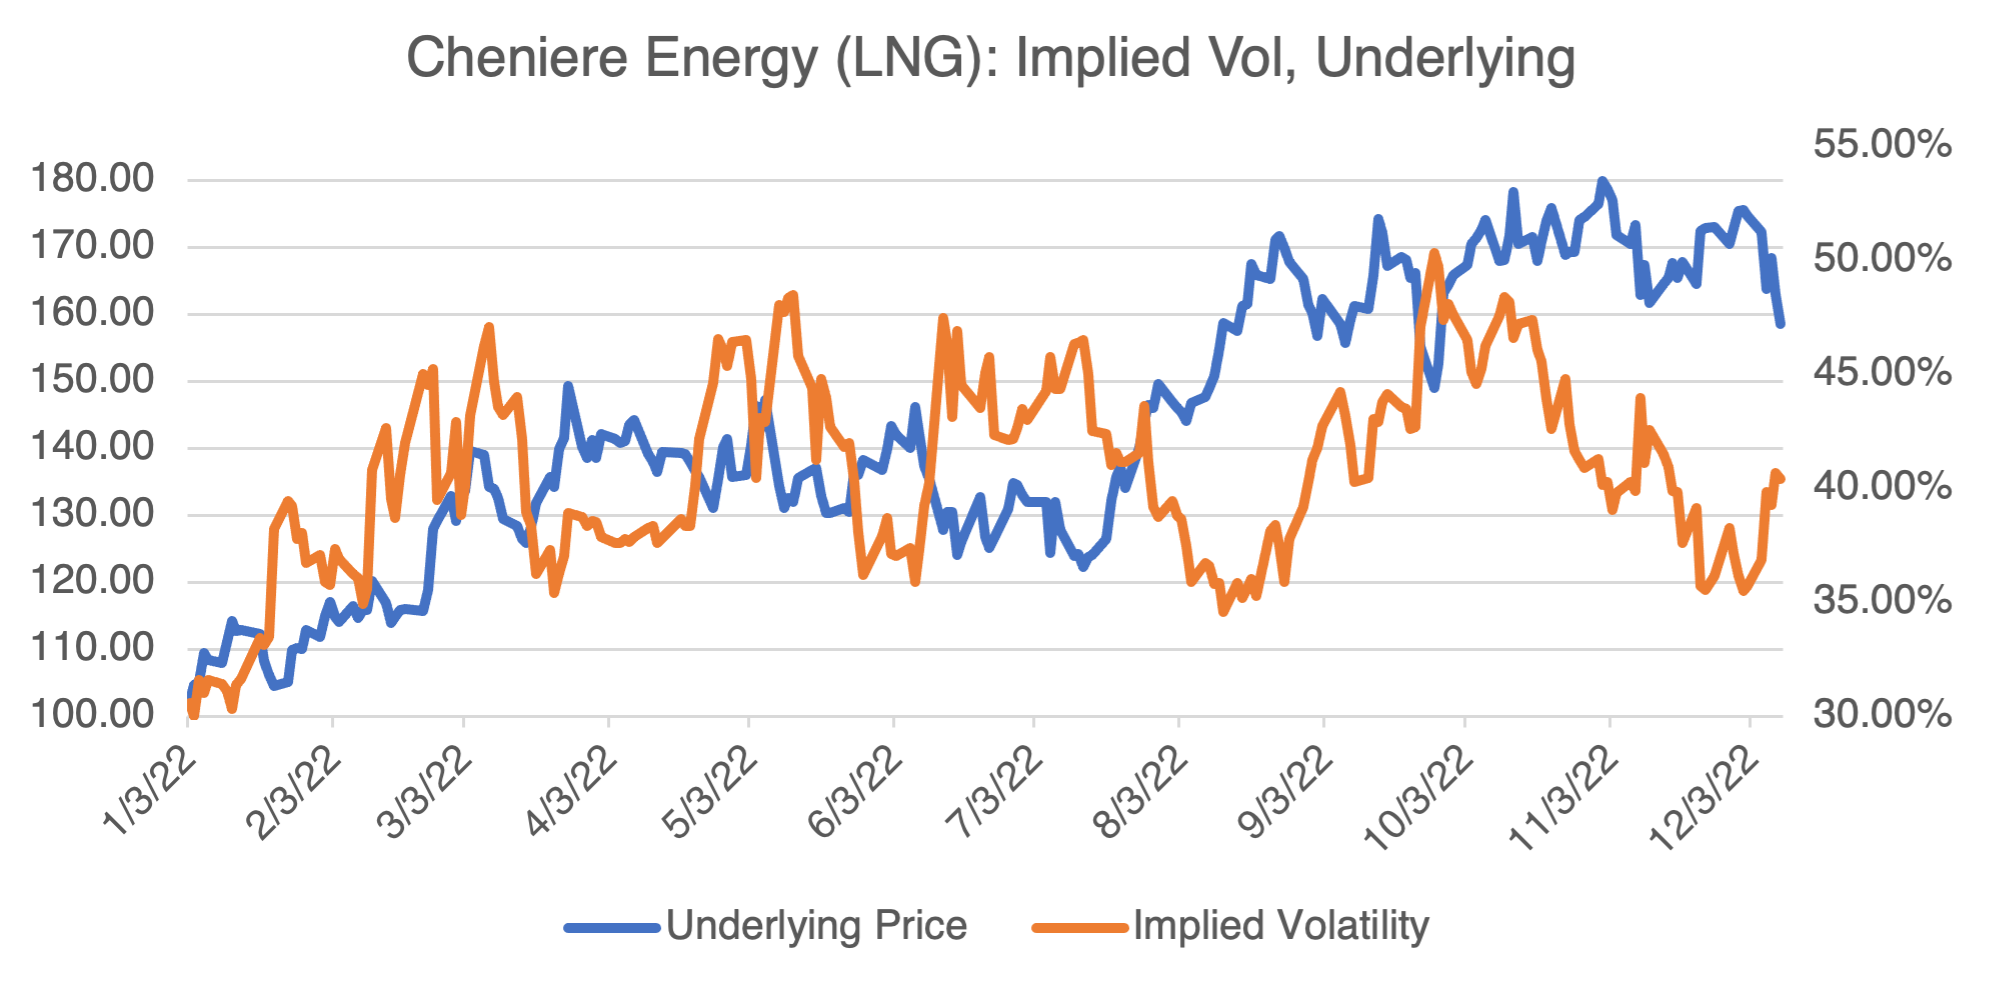
As I wrote last week, there are short and long term ways to play Cheniere, depending on your fundamental viewpoint:
1) If you believe that the mild European winter has relieved their energy crisis, then it follows that LNG might break out to the downside of its $148.95 (09/26/22) – $179.86 (11/01/22) range that’s been in place since last summer. In that case, uncertainty regarding the stock’s future price direction will likely also increase, driving implied volatility higher. If both of those events occur, then there’s no reason to get too fancy — a simple put will suffice. We reviewed this strategy and its related greeks last week.
2) Since LNG has been in a trading range since last summer, you may conclude that it will either stay within the range or finally break out. In that case, straddle or strangle strategies may be appropriate. You can use the build menu at the top of the site to play around with them in our options profit calculator.
To review, straddles are comprised of both puts and calls at the same strike and expiration; strangles are similar but don’t have the same strike. In both cases, you pay or receive the premium from both options. Usually, straddles are struck at the money. For example, with LNG trading roughly $155, the March $155 straddle ($155 calls and $155 puts) is trading at $23.55. If you bought the straddle, the P/L chart at expiration is below:
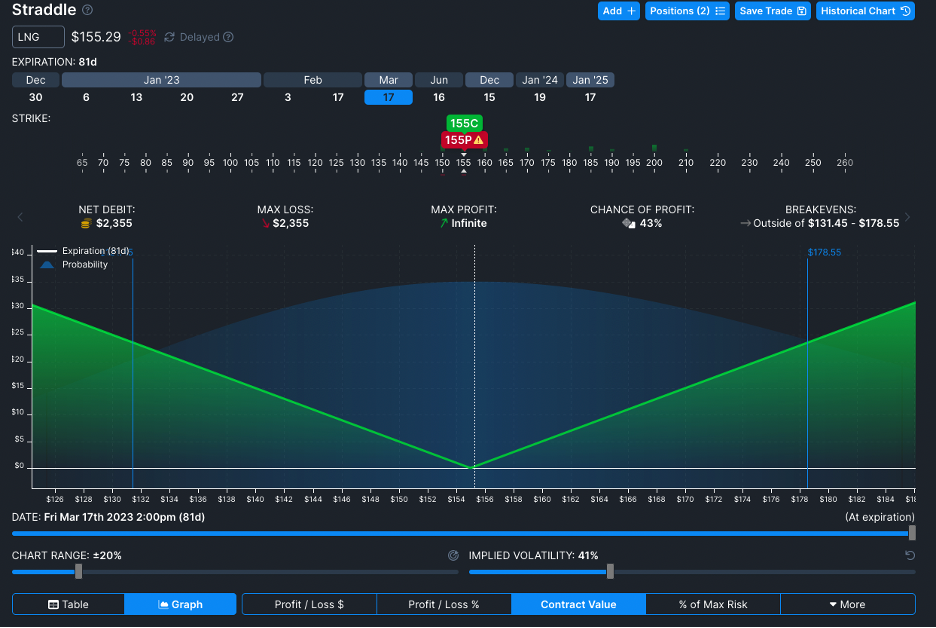
The breakeven levels ($131.45 and $178.55) are calculated by adding or subtracting the total premium paid ($23.55) to the strike ($155). Put another way, LNG will have to be more than 15% higher or lower at expiration before any profit is realized.
Notice from the historical price and volatility chart above that the recent range has been roughly $149 to $180. Breaking out to the downside all the way down to the lower breakeven, $131.45, might be a stretch. In that case, you can either sell the stradle or try a similar strategy, a strangle.
A strangle is similar to a straddle, but the strikes are not the same. You could then construct a position that is customized to LNG’s recent trading range. Using LNG again, one example would be the $145 put and the $180 call. The P/L chart is below:
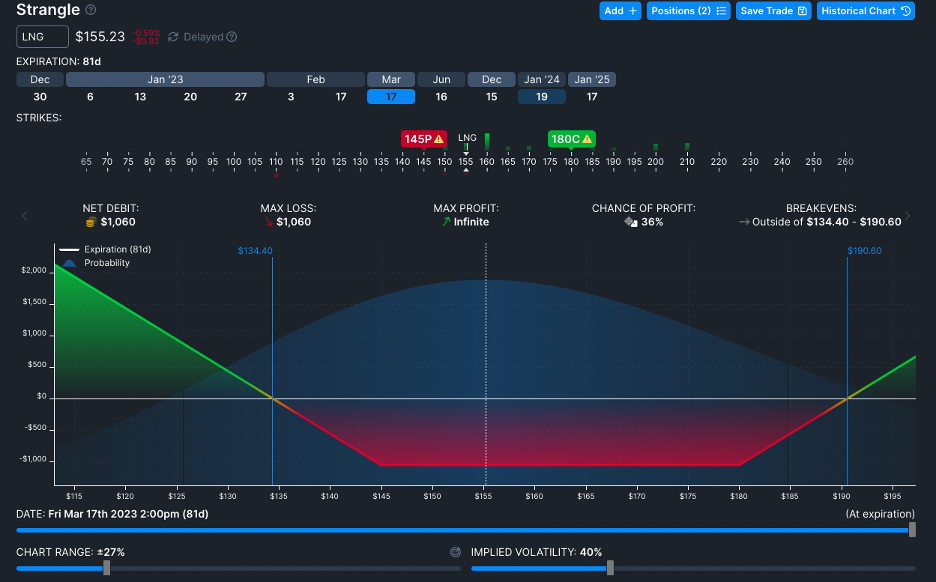
As I mentioned in the last blog, the results above are at expiration. Before then, they will be subject to changes in volatility and time decay and will vary from the P/L charts displayed above.
2022 Is Over (Finally)
An interesting year, to say the least: inflation, war, an energy crisis, a tech wreck, and a crypto meltdown. For those of you tempted to predict what 2023 has in store, consider the following: did any of the predictions that you made at the end of 2021 (or any year, for that matter), come even close to what actually occurred? Better yet, try this thought exercise: go back just 5 years from any date and see if any of the predictions from that date were accurate. You will find that very few of them were, and those that were were more a matter of luck than anything else. So, the next time someone predicts what’s going to happen in 2050 or 2100, or even next year for that matter, take it with a huge grain of salt!
And with that, I wish you all a happy, healthy, and prosperous new year!
Brett Friedman