Small-Caps and Mean Reversion
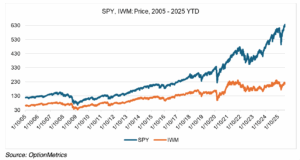
Lately, there has been a lot of attention paid to the spread between small and large-cap stocks. Specifically, the spread between them, as represented here by SPY (SPDR S&P 500 ETF) minus IWM (iShares Russell 2000 ETF), continues to make new all-time highs:

The main reason for this isn’t hard to figure out: large tech stocks, led by the Mag 7, have been driving the S&P higher, and currently represent about 36% of its capitalization. Nvidia’s market cap alone is 45% greater than the total market cap of the entire Russell 2000. At the same time, the lack of small-cap techs has led to significant underperformance in their related indexes. Since 2014, SPY has jumped 236.6%, almost 2.75 times greater than IWM’s 86.3% increase:
Regardless, many point out that small-caps have historically outperformed large-caps by almost 2.9 percentage points annually since 1926, and that mean reversion will eventually come to their rescue. Of course, “eventually” can be a very long time, and it hasn’t been true for at least the last 10 years. As a matter of fact, small-cap underperformance has only accelerated since the rise of AI and index investing. That would be ok if small-caps had lower volatility, or behaved better during down years, but they don’t. As you can see below, IWM IV trades consistently over SPY IV on an implied volatility basis:

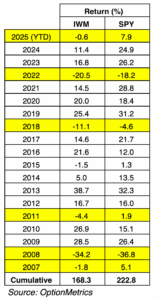
In addition, during down years (highlighted in yellow, below), IWM’s performance is usually worse than that of SPY (with only one exception since 2007):
Proponents point out that if AI hype turns out to be just that, it will send investors rushing into the small-cap market. Maybe, or they might just reduce their positions or exit the market altogether. Last April, in the midst of the tariff panic, the SPY/IWM spread fell briefly — but recovered just 20 trading days later.
Despite the long-term trend, some investors are looking to small-caps for bargains. If they are viewing it as a strategy to take advantage of possible AI overvaluation (which should not be discounted — when Meta is reportedly offering 24 year-olds $250 million, you know something’s fishy), then maybe they’re on to something, as long as AI comes down to earth for more than just a few weeks. As for mean reversion, it may indeed be true, in theory and in the long term, but you could die, literally, before it comes true. In the meantime, you may have to suffer through many years, or even decades, of underperformance. Everyone is right given a long enough timeline, but that’s not a viable investment strategy. The object is to make money, not to be right — eventually.
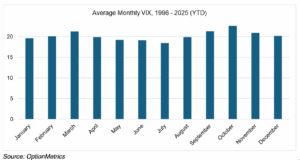
Summertime VIX
It’s mid-Summer, and I keep reading that July is historically the low point for the VIX. Whenever I hear that certain months or days or holidays are good or bad for the market, I’m always skeptical, so I decided to test whether it was true or not. Going back to 01/03/1996, I calculated monthly average VIX values, and it seems that July was indeed the low point for all months during the period; October was the highest. More generally, Q3 had the lowest readings and Q4 the highest. That being said, I should also add that all the averages are within a pretty tight range.