Santa Rallies!
Unbelievably, it’s December and we are approaching the end of the year. Almost always, traders now start talking about the so-called Santa Rally. As I’ve noted in the past, investors love patterns, rules, and metrics that they can use to justify their trades or possibly provide a tailwind to existing positions. Many are calendar-based and seek to determine which month, quarter, or time period during the year has the highest return.
The Santa Rally effect is one of the most popular time-based directional indicators. Although there are different variations, it’s the notion that stocks tend to rise during the final week of the year and the first two trading days of January, a total of 7 trading days. Notice that it only indicates direction of the return but not its magnitude. Fundamentally, the Santa Rally makes a certain amount of sense. Since most years are positive (about 72% of the time since 1926), the theory goes that long-term investors are buying for the new year. Coupled with the boost from holiday optimism, retail sales, and yearly bonuses, and the Santa Rally doesn’t seem so far-fetched.
Does historical data support the Santa Rally effect?
To find out, we started with 29 years of SPX daily data (01/02/1996 – 12/31/2024) and calculated the returns during the period specified by the Santa Rally (12/31 minus 5 trading days to 12/31 plus 2 trading days). We then compared them to the year-to-date returns before the Santa Rally period. The object was to find out whether returns were a) positive during the Santa Rally period, or b) whether they just reflected the prevailing year-to-date trend. In short, does the Santa Rally effect work because the market was already bullish?
The results are presented in the table below:
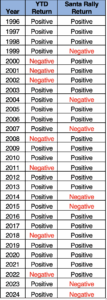
Out of 29 years,
- The Santa Rally produced positive returns in 22 of the 29 years reviewed, or 76%.
- 7 years produced negative returns during the Santa Rally period, or 24%, despite being previously positive year-to-date.
- There were 7 years with negative returns year-to-date. Of those, all 7 years, or 100%, produced positive returns during the Santa Rally period.
So…if you bet on the Santa Rally effect and the year is positive to date, you have about a 76% chance of winning. Apparently, year-to-date performance matters. At the same time, if you buy in anticipation of the Santa Rally effect when the market is negative year-to-date, you will have a 100% chance of winning. Finally, negative results during the Santa period do not seem to be indicative of next year returns.
Of course, all conclusions are based only on the 1996 – 2004 sample period. Since the sample size was relatively small, the conclusions are more suggestive than statistically significant.