New Premium Feature: Probability Distributions
August 31, 2021 - By Heath Milligan, OptionStrat Founder
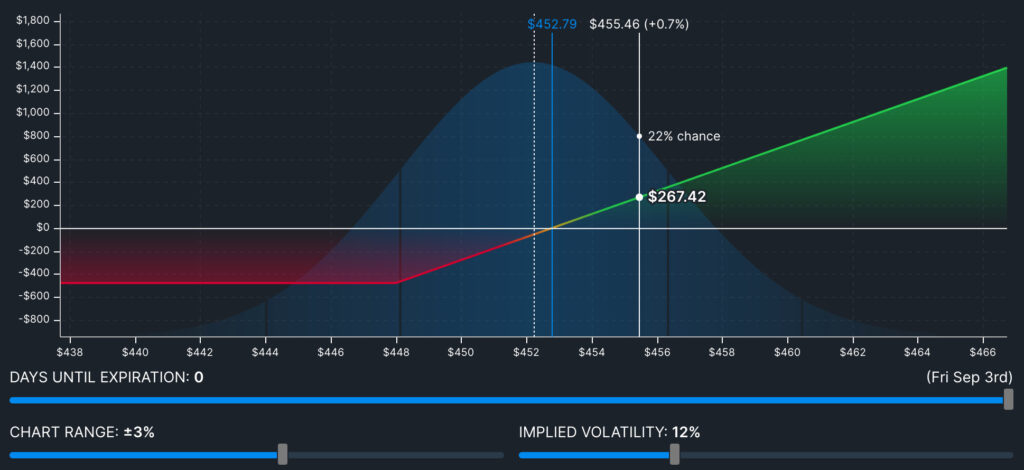
As an addition to the premium chance of profit feature, premium users can now view an overlay of the stock’s probability distribution when using the graph view in our options profit calculator.
The probability distribution shows how likely it is for the stock to reach a certain price. By using the days until expiration slider, or the IV slider, you can see how time and volatility affect the chances of the stock moving.
The lines on the distribution represent the implied move. The middle lines are drawn at +- the implied move, and the outer lines are at +- two times the implied move.
To get this feature and more, sign up for one of our premium plans.