Using OptionStrat’s Options Profit Calculator
When trading options, it’s important to understand the characteristics of your options strategy. An options profit calculator like OptionStrat is used to find the potential profit and loss at various prices, as well as show how your trade is affected by implied volatility (IV), time decay, and other factors. This article walks through how to set up a simple options trade on OptionStrat to visualize its profit and loss.
Setting up a trade
To explain how OptionStrat works, lets use a simple call as an example. On OptionStrat, you can can open a new call from the main page, or by clicking “Long Call” in the strategy menu. “Long” just means you are buying the call to open your position, as opposed to selling it.
For our stock, we will use GME (GameStop) which has seen a huge spike over the past few days. Will it keep going up? I’m not sure, but we’ll see what happens when it opens Tuesday after the long weekend.
Let’s pretend you do know something though (seriously, you should have a good idea on why it’s going to move – but we’ll save research for another post). You think GME is going to continue on it’s path to the moon 🚀, so you choose to buy a call.
Using the profit calculator table and chart
OptionStrat defaults to a call near the current price of the stock, and to a strike about three weeks out. In this case, that is the $30 strike GME call for February 5th 2021. We will keep things where they are for now and explain the profit table, which is the heart of OptionStrat.
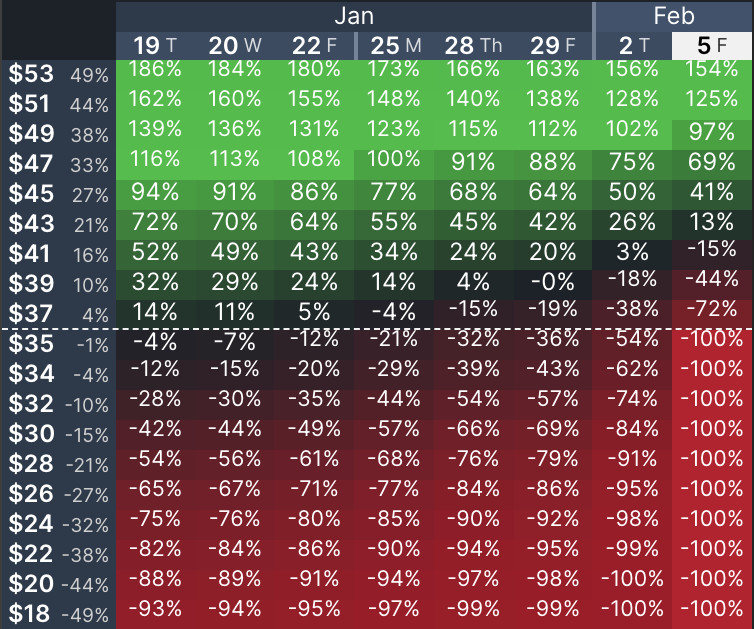
Screenshot of the profit and loss table
This table shows the expected profit and loss of your trade at various prices and dates. As you can see, if GME goes up 10% tomorrow to $39, we expect a profit of 32%. If GME stays at $39 by the time the contract expires, it will be worth significantly less since long calls and puts lose value as time passes (known as theta or time decay).
You can choose between viewing the profit and loss in dollars or percent, as well as viewing the actual value of the contract by clicking the buttons below the table. Additionally you can switch to graph view by clicking the graph icon, which shows the profit and loss as a graph for the day that is selected. Think of this as essentially a chart of a single date instead of all days like the table shows. You can use this if you want to look at a specific date more closely.
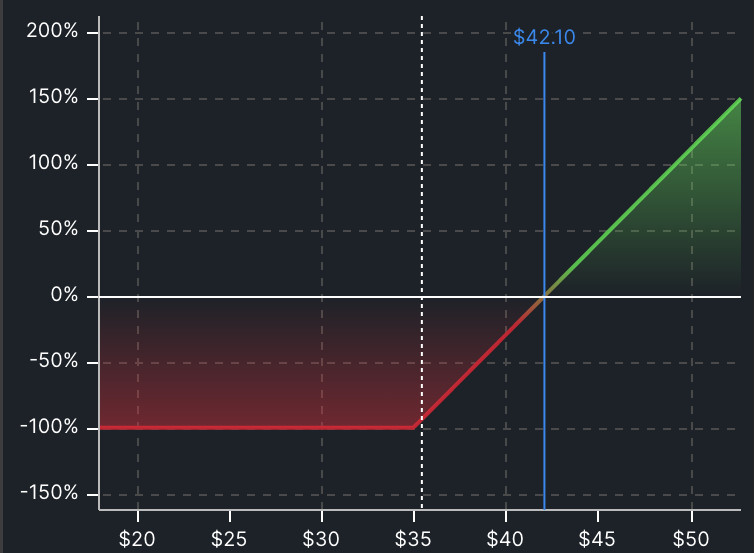
Screenshot of the profit and loss graph at expiration
You can see from the chart that this call will be worthless upon expiration, unless GME is above $42.10. By dragging the days ’till expiration slider, you can see how the profit and loss shape looks for each day until expiration.
Choosing the right strike and expiration
Now that you know how to use the table and chart, you can experience the real power of OptionStrat as any adjustments you make to the trade are shown in real-time.
To change the expiration date, simply click another date on the expiration slider.
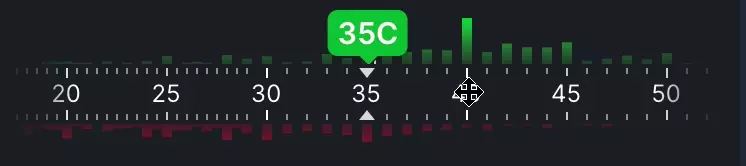
To change the strike, just drag the option to a different strike. You can also drag the entire strike slider to reveal additional strikes if they can’t all fit on screen.
OptionStrat also has a built in options optimizer, which does the hard work of searching through thousands of trades to find the trades with the highest return or highest chance of profit. You can open the optimizer here.
Reading the trade statistics
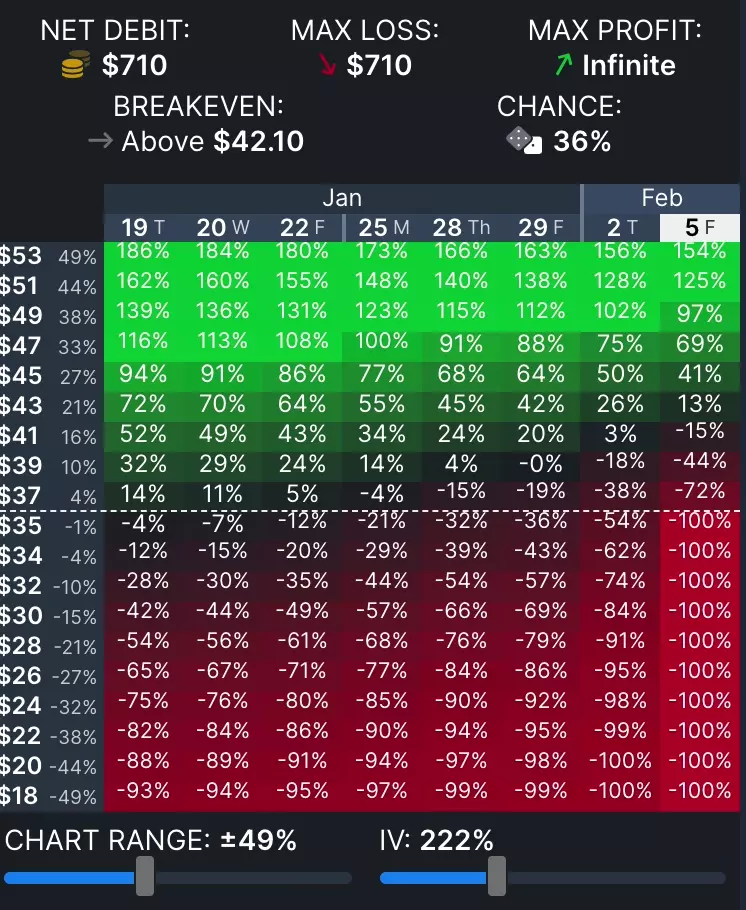
As you adjust the trade, you will also see the trade statistics change. These provide a quick view of some important characteristics about the trade such as the cost of it, the maximum profit and loss, and the chance of profit.
For a long call, the max loss will always be the price you paid for the option (the net debit, or cost). By dragging the strike, you can see that increasing the strike price will decrease your max loss, but also decrease your chance of profit. As with all strategies, the more risk you take, the more (potential) reward you get.
The statistics also show the breakeven price (or range), which is the price that the underlying stock needs to reach for your trade to be profitable on the expiration date.
Simulating market conditions
While OptionStrat is pretty accurate, it can’t predict the future. One of the biggest unknowns about the future is implied volatility. Implied volatility represents the expected volatility of the option, and is affected by the supply and demand of it. Many things can affect IV, such as upcoming earnings or other uncertainty. It’s important to understand that high IV means higher option prices. Essentially a stock is more volatile, or expected to make a big move in the near future, options will cost more since there is a greater chance of something happening.
Unfortunately, our GME contract has sky high IV at around 250%. Normally IV would be much lower, but because of the recent volatility and expectations that a big move will happen again, options are priced higher.
IV will soon decrease after a lack of news as the stock returns to normal, which will cause calls and puts to decrease in price. (After all, why would you pay so much for an option when the price isn’t expected to move much?) How exactly will this affect our call though?
With OptionStrat, you can drag the IV slider to increase or decrease IV. In this case, lower it (and lower it a lot, its IV this time last year was around 50%). As you can see, the IV decrease (also known as IV crush) makes this call look significantly less attractive. Instead of the call being profitable from just a slight move, it now needs a huge move to become profitable. If the call was currently profitable, it either isn’t anymore, or isn’t as much.
IV crush visualization
Inputting a previous trade
So far we have assumed that you are currently opening a new trade using the current option prices. If you already bought an option and want to see what the profit and loss looks like for your specific position, you can input the purchase price of the option.
To enter the purchase price, simply click on the option to open the option menu. From here, you can click on the price and enter your custom price. Now the calculations will be based on your purchase price instead of the current price.
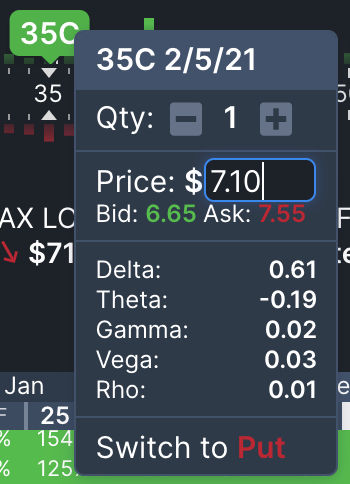
To reset the prices, you can either click on the option again and click the reset button, or click the reset button near the stock price to refresh all prices with the latest ones.
Additionally, this menu also shows the option greeks and allows you to edit the quantity. If you are purchasing 5 options instead of one, you can click the + button five times, or click the quantity to type a new quantity as you did with the price.
Other strategies
While this example was intended to teach you how OptionStrat works, you probably noticed that this trade isn’t the best idea. GME has already gone up a lot, and IV crush is imminent. To protect yourself from IV crush, you may want to consider another strategy such as a spread which is mostly neutral to changes in IV, at expense of less profit potential.
OptionStrat includes over 50 strategies with helpful descriptions and setup instructions. Hover over the strategy menu to see them all.
Saving strategies
If you have a strategy that you would like to track, you can save it by clicking the “Share / Save Trade” button. Note that you must sign up for an account to be able to do this. Saving a trade will give you a link that you can send to friends or post online, and will also track the profit and loss of the trade any time you come back to the page.

Options profit calculator app
OptionStrat is also available as a mobile app for iOS and Android. Search it in the app store to download it and be able to research strategies on the go. If you have an account, your saved trades will be synced between the app and website so you can monitor your positions on both.
Things to keep in mind
As mentioned before, IV is the biggest unknown for the profit calculator and you should play around with it to see how it affects your trade, since the calculator otherwise assumes a constant IV. Also be aware of upcoming events such as earnings or ex-dividend dates that will affect the option prices.