New Feature: Historical Price Charts
We are launching an exciting new feature for OptionStrat today: Historical price charts!
You can now view the past price history for any strategy by clicking the historical price button on the strategy builder screen. For single leg strategies you can select between line and candlestick chart mode. (Due to the nature of multi-legged strategies, where the high and low of each leg may occur at different times, it is not possible to create candlestick charts for multi-leg strategies)
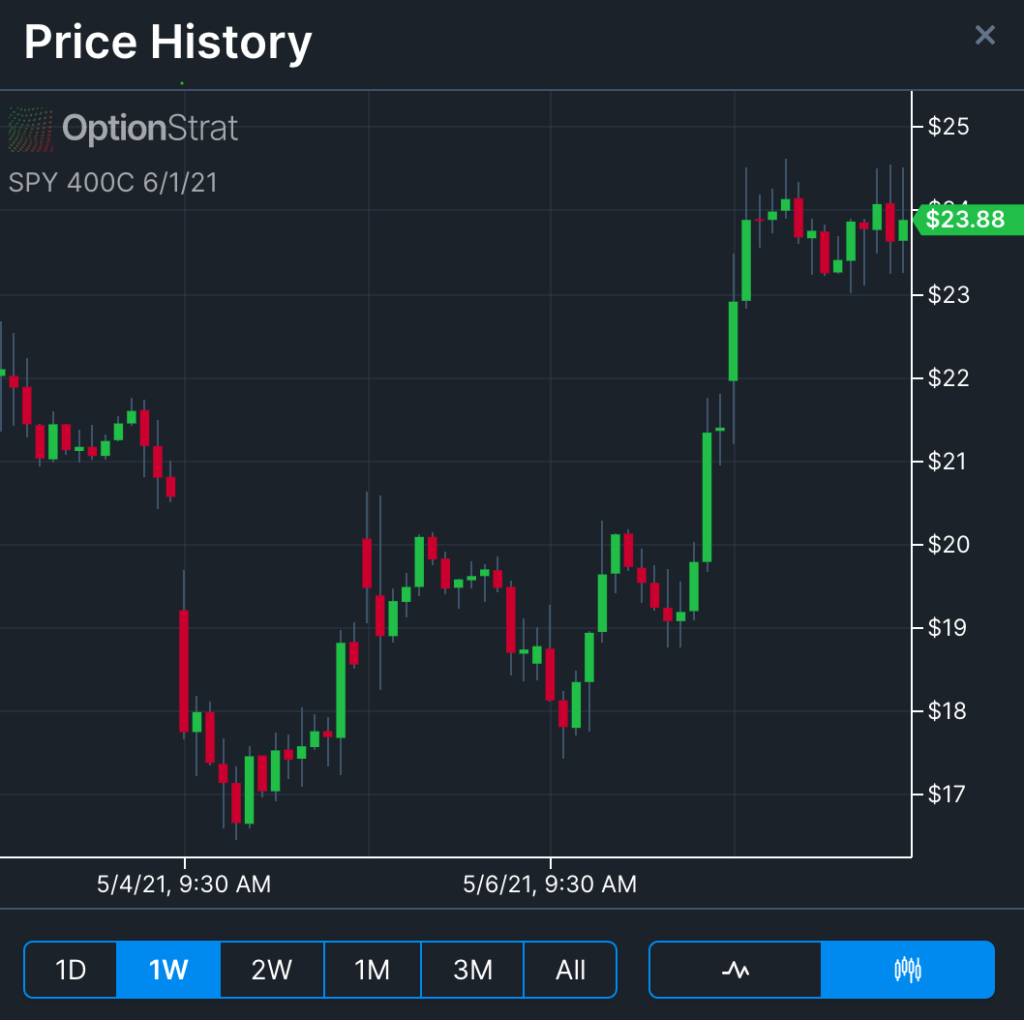
Screenshot a historical price chart
Additionally, users who are subscribed to the live options flow plan can see the performance of flow alerts in the flow details dialog. Subscribers of our tools plan will see a similar chart in the saved strategies area, showing the performance of your saved trades.
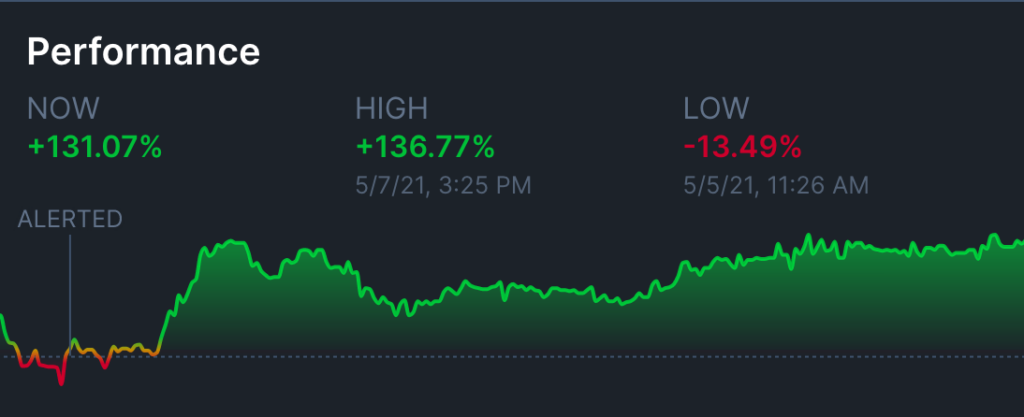
A performance chart is added to the flow details dialog
To see such charts for your saved trades, simply save a trade in our options profit calculator and then go to the saved trades page. Click the gear icon next to any trade to see information about it and the new performance graph and stats.