Oil, Again
The crucial piece of information that is driving equity and energy markets is when the war will end, or a ceasefire declared. “Relatively soon,” seems to be the consensus opinion, but no one seems to know exactly when “relatively” is. Can we get a clearer view from prediction and futures markets?
Of course, everyone can have an opinion using prediction markets. When the war will pause or end is a popular bet, with the majority thinking that it will wind up in 2 to 3 months and much more likely by the end of the year.

Source: Polymarket
The futures market forward curve provides a similar opinion, albeit on a slightly different question. Below is each contract for WTI crude oil plotted against price and time to expiration; the two curves represent 02/02/2026 and 03/20/2026 (before the war and last Friday).
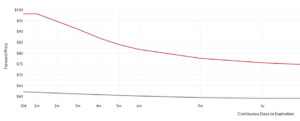
Source: OptionMetrics
Since the war began, the curve has shifted up, changed slope, and moved into significant backwardation (i.e., front contracts are priced higher than deferred). In crude oil, this is the “normal” curve shape. Backwardation occurs in commodities that have limited storage, making them particularly susceptible to supply disruption. Backwardation was at an all-time record high as of last Friday, March 20 due to traders bidding up the nearby months in an attempt to obtain supply.
The slope of the curve can give us a clue as to how long the futures market believes the war will last, or when the supply situation will abate. The spread between the front month and deferred contracts (the degree of backwardation) narrows as time progresses, but begins to flatten meaningfully at about the 6-month mark (mid-September). This could be because there is a ceasefire or Iran’s offensive capability to constrain supply has been eliminated. In either case, the futures curve, in agreement with the prediction markets, is forecasting that the supply situation will be relieved over the next few months.
Stocks: It Pays to be Picky!
Finance professors normally don’t get a lot of press. Hendrik Bessembinder, a finance professor at the W.P. Carey School of Business at Arizona State University (ASU), is the exception. He first caught the attention of the mainstream media with the 2018 publication of “Do Stocks Outperform Treasury Bills?” (Journal of Financial Economics), in which he concluded that almost all US stocks since 1926 have not performed better than US Treasury bills. Continuing on the same theme, Professor Bessembinder just published “One Hundred Years in the US Stock Markets,” which is basically an update of his 2020 work “Wealth Creation in the U.S. Public Stock Markets 1926 to 2019.” It is available here, and I urge you to read it.
In his most current paper, Professor Bessembinder reviewed investment outcomes for 29,754 common stocks listed on public U.S. stock markets from 1926 to 2025, and calculated two metrics, cumulative returns and shareholder wealth creation. Cumulative returns are each stock’s total return (inc. dividends) compounded over some period, in this case 100 years. Simply, it measures how much $1.00 of stock would grow if you never sold it. Shareholder wealth creation is the stock’s excess return over T-bills multiplied by its market capitalization. In other words, how much did the stock give back to shareholders compared to a simple investment in T-bills? Cumulative return rewards stocks that have been around for a long time and have generated consistent positive returns, regardless of size. Shareholder wealth creation emphasizes scale and size, often at the expense of cumulative return.
After running the numbers, Professor Bessembinder came up with the following results:
- Total shareholder wealth was enhanced by $91 trillion since 1926.
- Just 1,082 firms (3.7% of the total) accounted for 100% of the $91 trillion; only 46 firms accounted for half. Interestingly, when measured as of 2016, 89 firms accounted for the same percentage.
- The median return across all stocks was -6.87%.
- Only 48.2% of stocks generated a positive buy-and-hold return, and only 41.2% outperformed one-month Treasury bills.
Although you could probably quibble with some of his results and methodologies (as a practical matter, no one holds stocks for 100 years), the study confirms what index promoters have been saying all along – picking winners and losers is extremely difficult!
For your convenience, below are the stocks with the highest cumulative returns, highest 20-year annualized returns, and largest shareholder wealth creation.
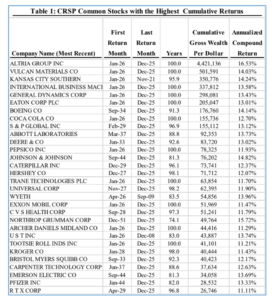
Source: One Hundred Years in the US Stock Markets, Hendrik Bessembinder, 2026
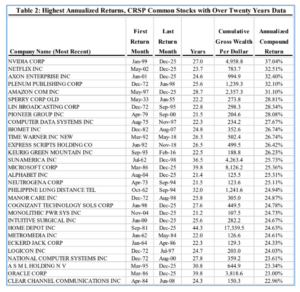
Source: One Hundred Years in the US Stock Markets, Hendrik Bessembinder, 2026
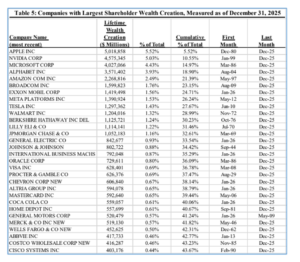 Source: One Hundred Years in the US Stock Markets, Hendrik Bessembinder, 2026