New Greek Visualization Features
Our options profit calculator tool is used by traders around the globe to visualize the potential profit and loss of option strategies over time. Many traders tell us it’s the first step they do before thinking about entering a trade. However, understanding how your strategy will perform over time is only one piece of the puzzle. With this new feature launch, we are proud to be the only options profit calculator application that provides visualizations of your strategy’s exposure to greeks.
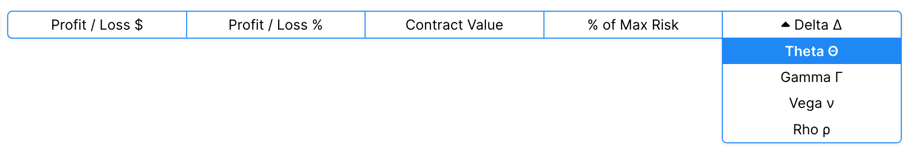
Premium members can now visualize how greeks evolve over time, with volatility changes, and with underlying price changes. These greek visualization features are available in both the table and chart views. Access them through the dropdown menu by the list of output types:
For example, a simple call or put is subject to theta decay over its lifetime. This decay accelerates as expiration nears, as seen in the following visualization.
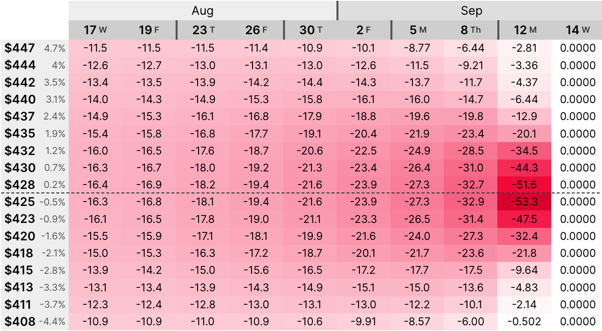
(Theta over 30 days for a SPY call)
Here is another example using a bull put spread. A bull put spread decays when the position is losing, but has the opposite affect when it is profitable. This means that time is actually helpful to a spread when it is in the profitable zone.
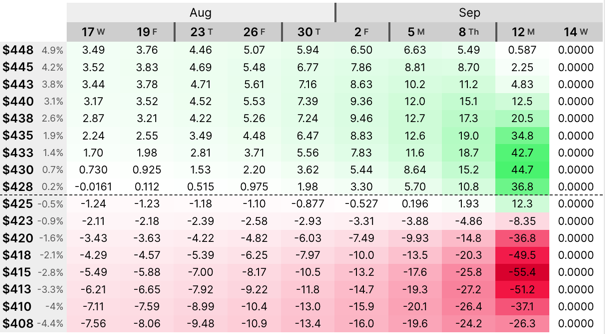
(Theta over 30 days for a SPY bull put spread)
Likewise, while traders often experience “IV crush” by buying calls or puts near earnings, a spread is less exposed to changes in volatility. In fact, if the spread is in the profitable area, a decrease in volatility actually helps it!
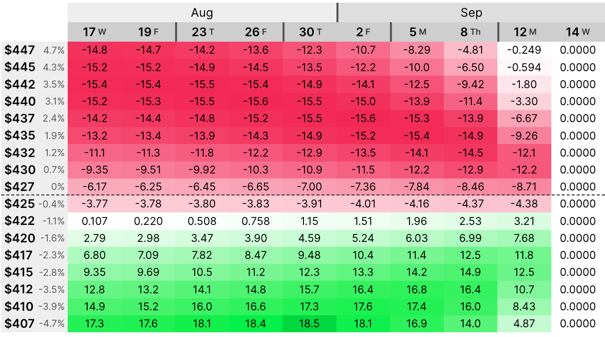
(Vega over 30 days for a SPY bull put spread)
This feature works with any strategies, including any custom strategies you build. For more information on our premium memberships, please see our pricing page.