Is the VIX Going to Pop?
The VIX, everybody’s favorite volatility index, closed at 14.25 last Friday (08/14/2026), its lowest point this year. Since the VIX only gets attention when it’s very high or very low, the media was quick to point out that higher volatility must be right around the corner. It’s tempting to be a contrarian, and predicting the future direction of the VIX and its ramifications is no exception.
“The calm before the storm” more or less sums up the contrarian’s argument. Currently, The VIX has averaged 16.56 so far this month, placing it mostly below its long-term averages.
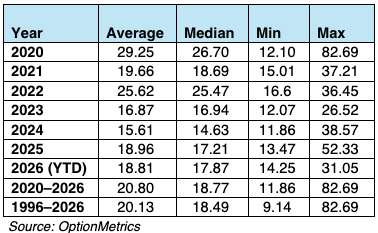
Contrarians point out that the VIX is mean reverting and will naturally gravitate to its long-term average. And since the VIX and the SPX are negatively correlated, this might be accompanied by a declining SPX. In short, the market is too complacent and setting itself up for a possible downward spike.
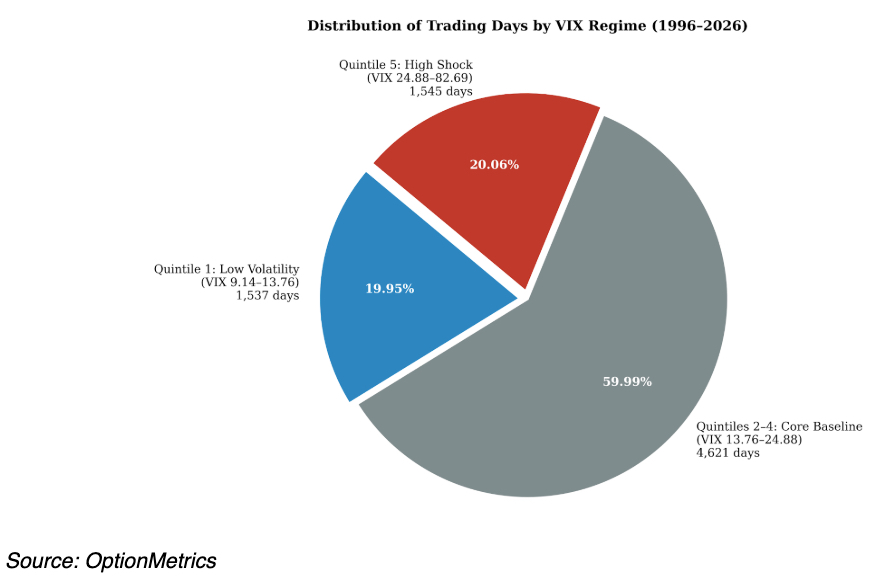
Before proceeding, let’s review two characteristics of the VIX that are the basis for the argument, mean reversion and negative SPX correlation. First, is the VIX really mean reverting? Yes: other than technical statistical proof, almost 60% of all VIX observations are in the interquintile range (i.e., quintiles 2 – 4) and tend to stay there (see chart below). Moves into the first and fifth quintiles are usually relatively short.
The VIX and SPX are negatively correlated: when the SPX falls, uncertainty rises, pushing the VIX higher. There is another, more technical reason as well. Share prices are the discounted value of their expected future cash flows. When the VIX is high, cash flows are more uncertain, and the discount rate increases to reflect the higher risk, reducing share prices.
Both VIX characteristics support the contrarians’ argument. The VIX is low, so it should mean reverting higher. And, since the VIX is negatively correlated to the SPX, the SPX should go lower.
What’s the problem with this argument? It’s simple—both characteristics are true on average, but not 100% of the time.
Although it’s true that extreme complacency (low VIX values) or fear (high VIX values) rarely lasts, there are significant exceptions. As you can see below, extreme periods can yield extreme results, as evidenced by the longest continuous periods spent in quintiles 1 and 5:
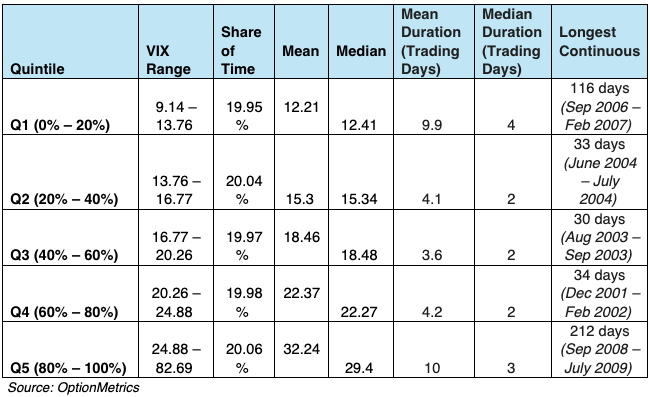
During those periods, you would have waited quite a long time before the VIX mean reverted. In the extreme, mean reversion can be a very long process. If your trade depends on reversion, it can prove frustrating, time-consuming, and expensive. The trick is not to determine if it will revert, but when.
Depending on negative correlation has the same problem. Although the SPX and VIX are strongly negatively correlated (-0.77), there are periods in which the relationship breaks down (see below). For more than 2 consecutive days it’s rare, but not impossible.
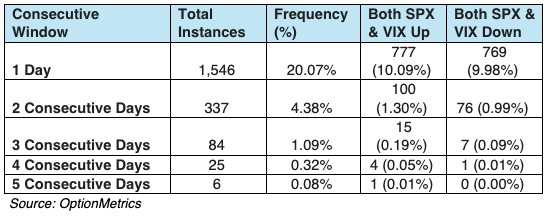
As I hope you can conclude by now, mean reversion or correlation trades can backfire spectacularly when normal long-term relationships fail. Keep in mind that most market analysts do not have a daily mark-to-market or margin requirements to contend with. As such, they can afford to wait out a move that in their opinion doesn’t make any sense or isn’t conforming to the long-term trend. Traders or investors with real money on the line don’t have that luxury. Eventually, either your risk manager, your broker, your spouse, or your bank account will force you out. “The market can stay irrational longer than you can stay solvent” is a well-worn aphorism and can be all too true to those with skin in the game.
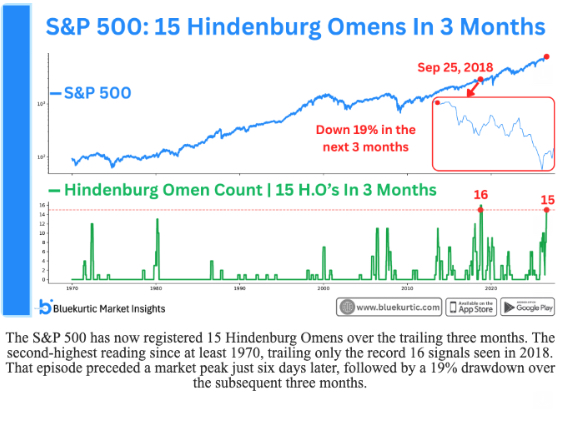
Scary?
This is from my ex-colleagues at bluekurtic. The Hindenburg Omen has a decidedly mixed track record but is interesting nonetheless. More on this next week.