Green Investing: Not the Color of Money
Last September, I wrote a blog entitled Green Risk, in which I detailed some of the disappointments that green investors have faced. My point was not to question their desire to limit carbon emissions, but to point out that investments “have to make sense economically and must be feasible…, no matter how pressing the need, the politics involved, or how much market hype is present.” Of course, that assumes that your primary goal is to make money. Affecting change may also factor into your investing strategy and may lead you to accept lower returns. Exactly how much lower is up to you. And in the case of green energy, it can be a lot lower.
Since I last wrote about it six months ago, the situation for existing green investors has gotten even worse. Below are one year and year-to-date returns for a variety of green energy stocks, as well as for the S&P 500:
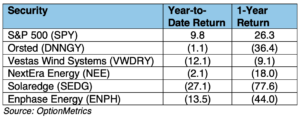
Why the bear market? New energy infrastructure is extremely capital intensive, and therefore, involves debt and sensitivity to interest rates. When interest rates increase, the breakeven and return on green projects decrease. Although seemingly unrelated, green stocks therefore became the innocent victim of the Fed’s efforts to tame inflation by raising interest rtable 1ates. Unintended consequences will always occur when government policy or regulations are involved, no matter how necessary or well-intentioned, and this is good example.
Despite all this, there may be some hope on the horizon. Interest rates have been coming off, albeit at a glacial pace and inconsistently. As well, crude oil prices have been creeping up lately and are slowly but surely getting within spitting distance of the psychologically important $100 barrier, the level at which oil and alternative energy sources start to get renewed attention.
Both factors may serve to bolster green energy stocks, but those looking for a bargain should keep in mind that they should be viewed as long term investments dependent on the eventual transition away from fossil fuels. In this case, “eventual” could be a lot longer than commonly thought or hoped.
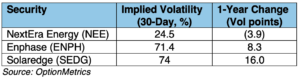
For options investors, implied volatilities (30-day expirations) of these stocks have been, for the most part, increasing or staying roughly stable as their future uncertainty increases.
For those leaning towards longer term options, keep in mind that their vega, or the change in premium from a 1% change in implied volatility, increases with time to expiration and is maximized as the option or strike approaches at-the-money.
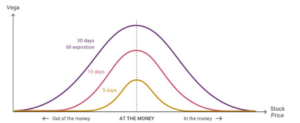
Why is this? Most simply, if you think of option pricing as a guess on where a stock is going to wind up at expiration, then as that time increases, uncertainty as to the outcome should also increase. Think of it like the weather. If I asked you what tomorrow’s weather was going to be, you would have a pretty good idea. But, if I asked you what the weather was going to be in a year, exactly, you would be a lot less sure. Similarly, long-dated implied volatilities don’t change that much from day to day. Continuing the above analogy, your opinion about what the weather will be in one year will probably not change all that much as long as it remains in the distant future.
As I’ve written previously, this is not just a technical detail; the effect can be significant.
You can see this real time in OptionStrat using the vega display for an at-the-money. As an example, see below for the vega display for a simple atm $65 Solaredge (SEDG) call, premium = $19.25. Using the slider on the bottom, you can conveniently change the implied volatility to see how the vega will change in relation to time to expiration and the underlying.
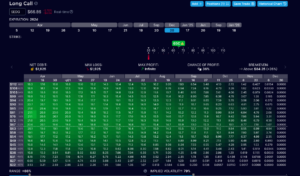
Source: OptionStrat