Gold. The New Nvidia?
People not directly involved in finance tend to tell me two things during sharp sell-offs. First, they mention how they liquidated nearly everything months before, and second, how they bought something that is now taking off. The latter is almost invariably gold.
Gold is the new Nvidia. Economic and political disorder, instability, and uncertainty are tailor-made for it, and that is exactly what we have right now. For true gold bugs, bad news is good news.
I’m not going to go over the long-term rationale for buying gold. Everybody knows it by now, and either you believe it or you don’t. Like many other things lately, there doesn’t seem to any middle ground.
That being said, it’s interesting (and cautionary) to note that gold was not completely immune to the panicky sell-off that occurred during the first few days after April 2nd. Gold initially declined over 6% as investors rushed into cash. As the 2008 financial crisis demonstrated, de-risking occurs across the board. Sell everything becomes the order of the day. During these times, and contrary to what many wealth advisors would have you believe, diversification is not going to rescue you.
After it became clear that the tariff war was just the beginning of an uncertain morass, gold resumed its upwards trajectory and hasn’t looked back since. The President’s latest contribution to uncertainty, his attack on the independence of the Fed, gave gold yet another bullish injection. As of this writing on Tuesday morning, gold is up 29.1% year-to-date, continues to make new all-time highs, and shows no signs of slowing down.
Given that almost ever fundamental is supporting gold, it seems that buying it makes sense. At the same time, given all the mainstream attention it is attracting, and the breathless headlines, is gold getting overdone?
To find out, I looked at three metrics from the CME gold futures market to see if they are reaching extraordinary levels or exhibiting unusual behavior: implied volatility, the degree of out-of-the-money to at-the-money options skew, and the shape of the futures curve itself. Each can act as an informal indicator to determine if sentiment has shifted too far in one direction, possibly indicating either a slowing trend, or even a reversal.
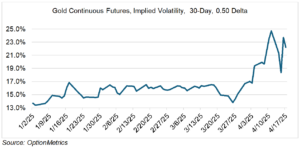
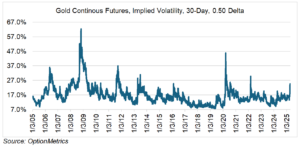
First, implied volatility. As you can see (chart below), and somewhat counter intuitively given what’s going on and its reputation, gold trades at relatively low volatility levels compared to other commodities. Since 2005, its long-term average is only 16.8%. Implied volatility is a function of the variance of daily returns; historically, golds have been relatively low and stable, despite its most recent price action.
However, gold’s 30-day implied volatility is now almost a full 10 percentage points higher than it was at the end of March. Uncertainty has increased, as have intraday price swings, so this shouldn’t be surprising.

However, when viewed on a long-term basis, the increase isn’t that unusual:

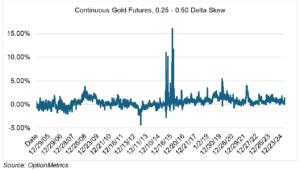
Second, gold’s out-of-the-money to at-the-money skew. Retail options investors tend to buy out-of-the money strikes because they are inexpensive in dollar terms, bidding them up in relation to the at-the-money strikes. The degree of the skew can then be used as a sentiment indicator. Like all sentiment indicators, it works as a contrary metric, but best at extreme levels.
Gold’s current 0.50 to 0.25 delta skew has average 0.50 percentage points since 2005. Currently, it’s about 1.30 – 1.40 percentage points. As you can see below, although the skew is high, it is not extraordinary or unusual on an historical basis.

And finally, the shape of gold’s futures curve. Since gold may be stored, the futures curve trades in contango (near expiration prices are less than deferred). As the curve steepens, it indicates the degree to which investors are comfortable with the long-term trend. Similar to options skew, this is a contrary indicator (are investors too comfortable?), and useful only if extreme or unusual shapes are present.
Although the one month to six month curve has been steepening since the beginning of 2022 (charts below), it has been relatively stable since the beginning of the year. The spread has been widening somewhat during gold’s latest acceleration, but not enough to merit concern.

On balance, and given the readings of the three futures indicators above, it seems that gold is behaving in an orderly manner and not exhibiting behavior that would indicate an overbought condition (at least not yet). Simply, it is responding to economic and political circumstances that are ideal for its continued appreciation.
Another factor might also be at work. Currently, gold is one of the few assets that has a clear bullish trend. If you want a workable hedge, it’s the only game in town. That might be attracting buyers from other asset classes looking for protection, pushing gold up. If the equity, fixed income, and foreign exchange markets stabilize for more than just a few days (admittedly, that seems like a long shot right now), it will be interesting to see if the newcomers stick around.