Geopolitical Shocks Are Not That Shocking!
Before I get into last week’s options analysis, I think it best to quote an old friend of mine from the markets:
I am not a geopolitical analyst and I have not become one since Russia invaded Ukraine. I will not comment on Putin’s motivations nor his endgame for Ukraine. There are people who are far more educated on those sorts of things than I am… – Richard Gluck
If only others had the humility to stay in their lane!
Like my friend, it’s my job to speculate about markets and options using my hard-earned experience as a guide. In so doing, and despite conventional wisdom, I fully believe that financial history doesn’t really repeat itself, it just kind of rhymes with what we’ve seen before. In other words, reminiscent, but not a replay, a sequel if you will.
With that in mind, what have we seen before? When it comes to hostilities and their effects, political scientists can finally start earning their pay. This table of geopolitical shocks since 1941 tells an interesting story:
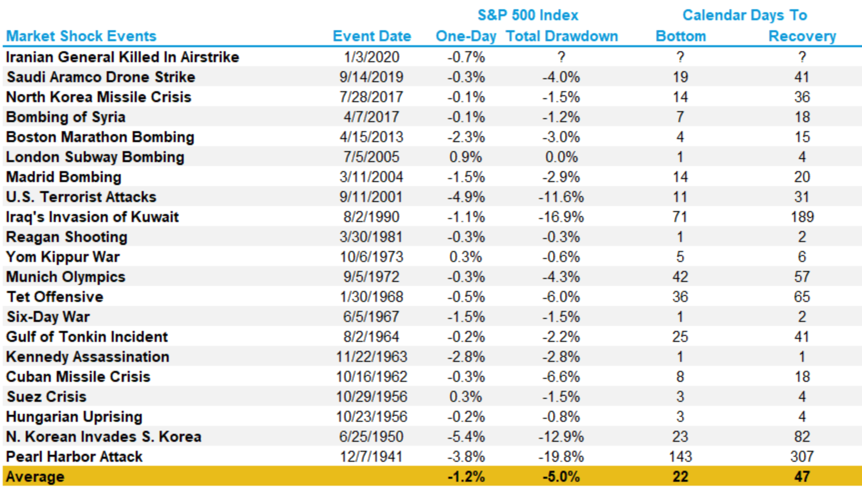
Source: LPL Research, S&P Dow Jones Indices, CFRA, 01/06/20
Looking at all the events (and trying to remember where you were when they occurred), we can conclude a few things:
- Geopolitical shocks of various magnitude that cause truly lasting market effects (i.e., longer than roughly three months from bottom to recovery) are pretty rare: only two events out of 21 qualify in the last 81 years!
- Even Pearl Harbor, one of the most consequential events of the 20th Century, caused a market decline of slightly less than 20% (the level generally perceived to be a bear market). The market recovered in less than a year and you can’t get much more of a shock than WWII.
- Geopolitical shocks require pre-existing economic conditions and must be truly global in nature to have a lasting effect. In other words, they don’t change the underlying trend as much as act as a catalyst for what’s already been occurring.
Having traded through more than my fair share of craziness, I can say that it takes the market a while to recover intraday and interday stability. Although the market may bounce back in the medium to long term, that’s the high-level view. On the ground, it will remain jittery and susceptible to bouts of extreme intraday volatility as the situation changes.
One interesting note if you’re interested in volatility and financial records. As most of you know by now, Russia supplies about 40% of Europe’s natural gas. Therefore, Putin’s ultimate weapon is to suspend shipments, leaving Europe to scramble to keep the heat on. Although he hasn’t – yet – he might, and that’s good enough to severely impact (to put it mildly) European energy prices, specifically natural gas. Before the slo-mo European energy crisis started late last Fall, most traders had never even heard of Dutch TTF natural gas futures. Without getting into needless details, think of them as representative of natural gas prices in Europe. What’s the point? Last Thursday, the first day of the conflict, they jumped roughly 50% and then on Friday fell 30%! In my experience, that’s one of the largest interday moves in an established, liquid commodity I’ve ever seen. Now that’s volatility!
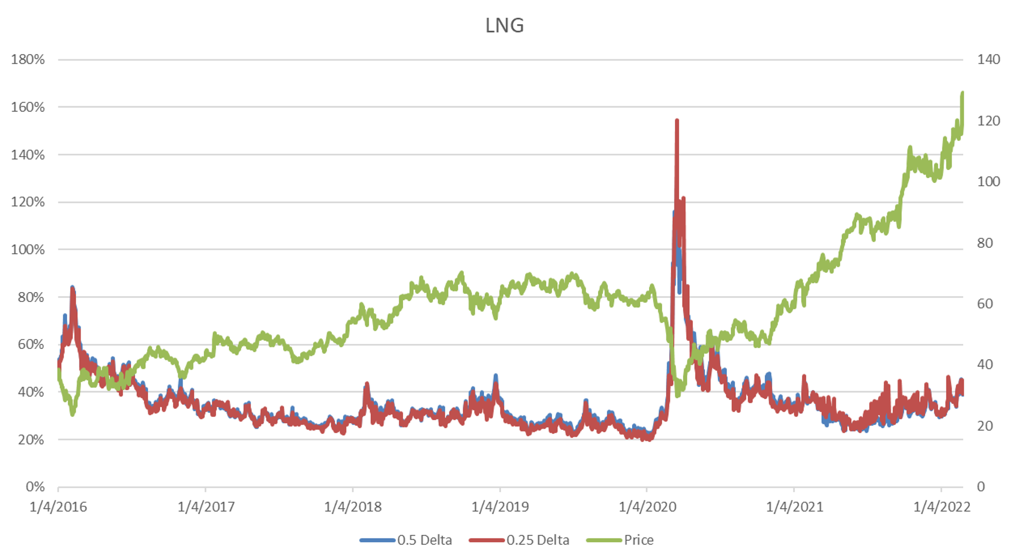
Speaking of volatility, and if you’ve read my last few articles, you know I’ve been following Cheniere Energy (LNG), a US based LNG producer (chart below). Whether we like it or not, certain stocks will benefit from the situation in Ukraine and Cheniere is certainly one of them. From an options perspective, and although its underlying price has been accelerating since the beginning of 2022, LNG’s implied volatility still has not broken out from the top of its range since 2017. Seen from that perspective, LNG options are still inexpensive from a volatility standpoint.