Fast Money!
It seems that investors are growing more impatient and want high returns as fast as possible. It’s therefore not surprising that high-flying IPOs with the potential for eye-watering short-term returns are back in fashion. Earlier in the year, Bullish (BLSH), Circle Internet Group (CRCL), and Figma (FIG) all debuted spectacularly. On the first day of trading, they closed at 84%, 168%, and 255% over their IPO price. Of course, it didn’t hurt that they were involved in hot sectors and that the IPOs themselves were underpriced to begin with (evidently). Still, with short-term returns like that, it’s no wonder that investors are looking for the next hot IPO.
This week, the two getting the most attention are Klarna (Wednesday) and Gemini Space (Friday). Others include Figure, Legence, Regentis, Black Rock Coffee Bar, and others. If you want to trade IPOs, you have a lot to choose from.
I always wondered whether investor opinions on IPOs were overly influenced by those that achieved spectacular returns and attracted the most attention. I also wondered how they did over the long-term. The only comprehensive study I could find on IPO performance was from the NASDAQ in 2021 (What Happens to IPOs Over the Long Run?, P. Mackintosh, 2021).
The results are interesting, but not surprising:
First, IPO performance seems to deteriorate over time (see table below). In their first day of trading, over 50% outperformed the market. However, that tends to slip as time passes. By the third year, 64% were trailing the market by more than 10% (see table below).
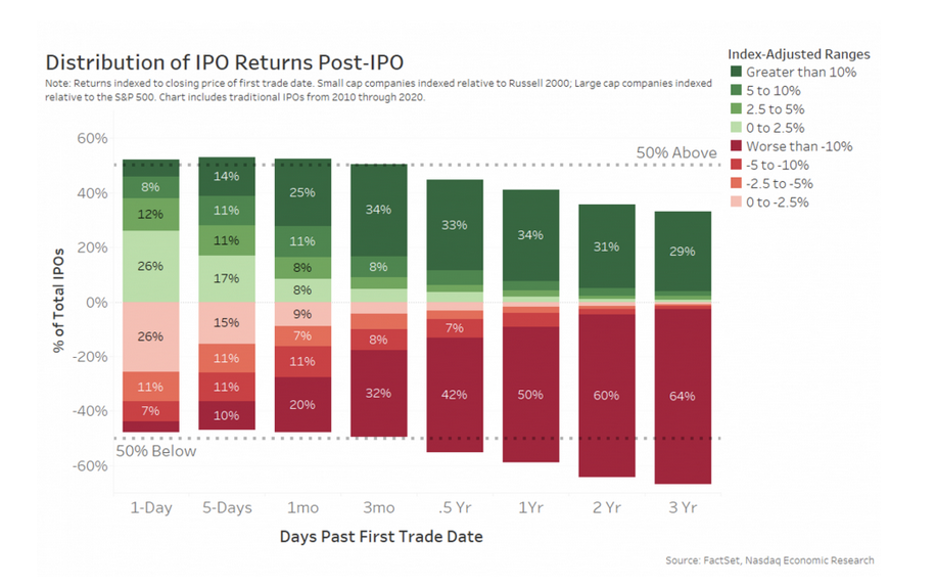
Source: Nasdaq
And second, although outperformers in the sample represented 29% of total IPOs, their degree of outperformance was significant, with the top 10% gaining more than 300%.
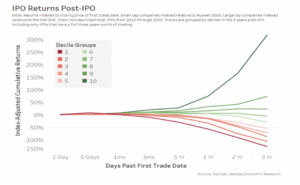
Source: Nasdaq
Although the study was conducted over four years ago, I suspect the findings are still valid and will not change significantly if updated. My conclusion: if you find an IPO that outperforms the market in its early days, don’t overstay your welcome. Banking on that you found one in the top 10% is statistically not a good bet. Apparently, enthusiasm and hype can only go so far; reality, in the form of earnings and profitable growth, eventually intrudes.
Volatility, in Other Terms
I’m often told by new options traders that they can’t relate to volatility. They know it’s important, but don’t really get it. That’s completely understandable, since almost all investors think in terms of price, not volatility. Luckily, there are two easy pro tips that can help.
First, the price of a specific straddle can be interpreted as the price range (up or down) that the market is expecting until its expiration. For example, if a $100 XYZ straddle is trading $5.00 and expires in 10 days, then the market is expecting XYZ stock to be between $95.00 and $105.00 over the next 10 days. That range is derived from XYZ’s implied volatility, which will change over time. As IV increases, the range will increase, and vice versa. Intuitively, that makes sense: since implied volatility is a function of uncertainty, the expected price change will vary accordingly.
To get the same result, you can also derive expected price variation of a specific option by performing a simple calculation. If you know how many days there are to expiration, the current stock price, and its implied volatility, you can calculate the implied price range using the following formula: stock price * (implied volatility/100) * sqrt (days to expiration/365). The square root part is just de-annualizing the implied volatility down to the specific number of days to expiration. Nothing too magical here.
Knowing this little trick can be very useful, especially in the period before earnings calls or when trading short-dated options. When commentators say that market is expecting a certain price range before earnings, this is what they are doing. It’s also useful if you don’t have a feel for whether implied volatility is high or low, but do follow prices.
Of course, there are some assumptions that you should keep in mind. Since expected price ranges are based on the standard deviation of daily price moves until expiration, they will fall within the range about 68% of the time. If you double the expected price range, that number increases to 95%. Also, the expected range is an average over the period – some individual days will be higher, and some lower.
In other words, use expected range calculations only as a guide, and don’t be shocked if they turn out to be incorrect. If the models could predict the future with 100% accuracy, there wouldn’t be any need for options!