Crude Oil and the Hindenburg Effect
Frenzied predictions of market downturns are a longstanding feature of financial commentary. A casual scan of social media channels reveals a constant stream of analysts forecasting potential crashes, downturns, surges, depressions, conflicts, pandemics, and other extreme events. Whether they have been right, wrong, or indifferent doesn’t seem to matter. Understandably, since the onset of the war in Iran, they have reached a fever pitch.
It is therefore expected that many people are now focusing on technical indicators predicting imminent disaster. One of the more famous is the ominously named Hindenburg Omen (sometimes Syndrome), named after the eponymous 1937 disaster. Like many such indicators, it allegedly indicates the likelihood of a stock market crash and relies on several different criteria:
- The daily number of new 52-week highs and 52-week lows in a stock market index exceeds a threshold amount, such as 2.2%, 2.5%, or 2.8% (different thresholds are used);
- 52-week highs must be less than twice the 52-week lows;
- An uptrend must exist, as evidenced by the 10-week moving average or the 50-day rate of change;
- The McClellan Oscillator (MCO), a measure of advancing vs declining stocks, must be negative for 30 days after the above conditions are triggered.
How well does it work? As it turns out, its record is decidedly mixed. Below are all the times it’s been triggered against the SPX since 1996:
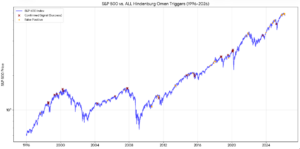
Source: OptionMetrics
A positive trigger was defined as a decline of at least 5% within 40 to 60 days of the signal. In all, there were 72 trigger dates; of these, 29 were successful and 43 were false positives, or about a 40% success rate. Not great.
However, supporters of the indicator assert that clusters, i.e. several trigger dates within a short time period, successfully predicted the dot.com bubble burst, the 2008 financial crisis, the pandemic crash, and the 2022 bear market. The more triggers packed into a short time frame, the higher the accuracy.
Since 2024, there have been several clusters, including 6 in February alone (see chart below). This has led many to warn that a crash is imminent. So far, however, only one of the signals (March 10, 2025) has proven successful. They may indicate structural weakness that could lead to a crash, but there has been no definitive signal just yet. That’s not to say that it won’t, and if oil spikes up further as a result of no progress in clearing the Straits of Hormuz, then the Hindenburg Omen may finally kick in.
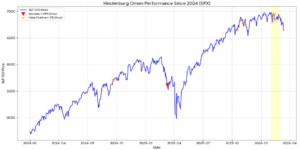
Source: OptionMetrics
As I’ve written many times before, there is no magic formula that predicts the direction of the market. However, there is one good use for all these indicators – they are a great way for social media commentators to get clicks and sell subscriptions (you have to ask yourself the obvious question: if the indicator is so good, why are they sharing it with the general public? And why don’t they just trade with it and make a fortune?). Purveyors of doom and gloom all capitalize on “negativity bias,” or people’s tendency to believe negative forecasts more readily than positive ones. That’s why they tend to remember when the indicator works, but ignore the many more times that it didn’t. The famous aphorism “predict disaster and be hailed as a prophet” still applies.