Apocalypse Now
Last week, I wrote that the shape of the VIX futures curve was backwardated, i.e., the shorter expiration contracts were trading over the more deferred. As I pointed out, this has only occurred about 19% of the time since 2006 and usually occurs only during periods of extreme stress, such as during the 2008 financial crisis or at the start of the pandemic. I went on to say that the backwardation was not the sign of a healthy market. That turned out to be quite the understatement.
From the markets’ reaction to the new tariff regime, you would have thought that President Trump had never mentioned tariffs before and that they were a complete surprise. This despite the fact that tariffs and inequitable trading relationships (whether good policy or true) were at the heart of the President’s campaign. The market, like most everyone else, just can’t figure Trump out. Salena Zito’s famous quote from 2016 is still true: “The press takes him literally, but not seriously; his supporters take him seriously, but not literally.”
With that in mind, you can see why most people are uncertain about the President’s conviction to follow through on his “Liberation Day” tariffs. Are they just a negotiating tactic, eventually to be moderated or amended, or are they a serious attempt to reorder America’s trading relationships with the rest of the world? In other words, is Trump just taking a page out of his own book, The Art of the Deal, and just pressing as hard as he can?
Who knows, but his shock and awe negotiating and governing style and his penchant for breaking things are two of his signature moves; both have worked for him in the past. The worry is that this time may be different, and the market is melting down until it figures out what he’s really up to or the President moves on to something else.
Uncertainty, a word that has gotten a lot of traction lately, is now the King of the Market. Explosive moves in the VIX are the result.
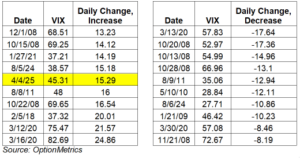
How explosive? Using VIX data back to 01/02/1996, we can see how its most recent moves stack up historically in both absolute and percentage changes.
Absolute VIX changes from the previous trading day:
Percentage VIX changes from the previous trading day:
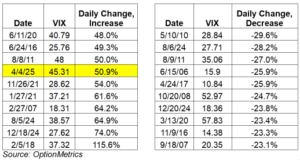
As you can see, the most recent VIX increases have made the top-10 list, whether measured on an absolute or percentage basis.
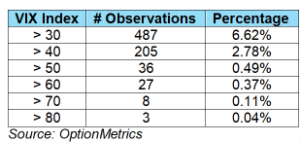
Putting the recent moves into context, and using VIX data going back to 01/02/1996 (7362 observations), you can see that extreme levels (defined here as > 40) are relatively rare:
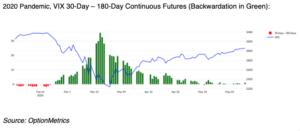
Compared to the two other panics we’ve had since 2000, the 2008 financial crisis and the pandemic (see charts below), current VIX futures backwardation has been relatively low and short-lived (so far). Currently, 30-day futures – 180-day futures is running about 10 percentage points. During the peak of the financial crisis, it was over 21; at the start of the pandemic, it peaked at over 35.

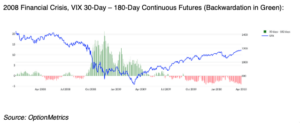
The bad news is that backwardation during the previous two financial crises accompanied several months of negative or lackluster SPX returns. The good news is that the SPX bottomed during those periods and rallied sharply afterwards.