Options Builder Tutorial
How to use the OptionStrat options profit calculator
When trading options, it's important to understand the characteristics of your options strategy. OptionStrat's strategy builder is used to find the potential profit and loss at various prices, as well as show how your trade is affected by implied volatility, time decay, and other factors.
1. Choose a strategy
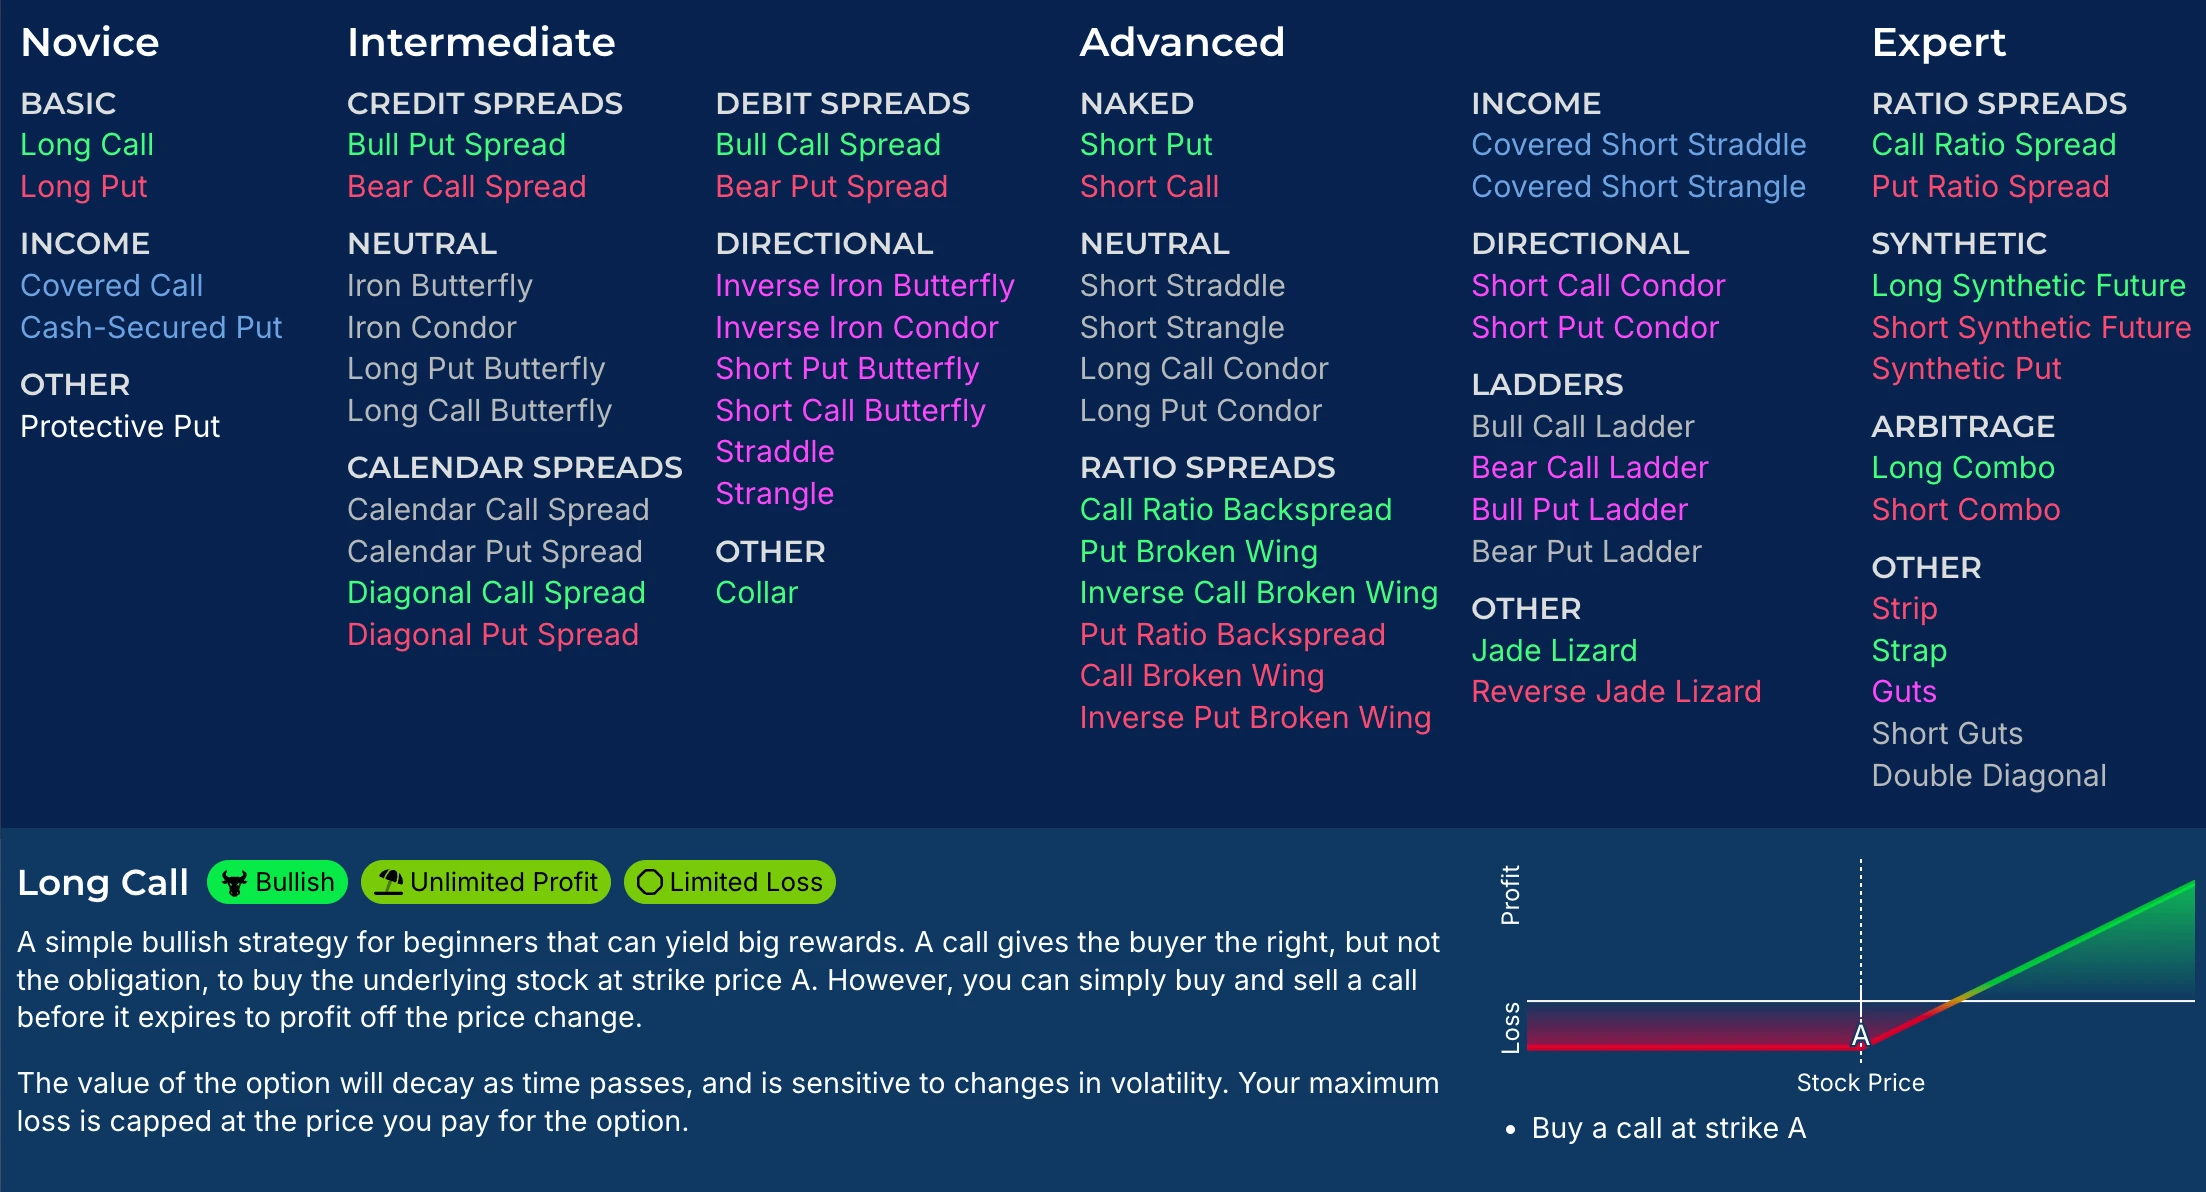
From any page you can use the menu to view the 50+ pre-made strategies. Hover over a strategy to read a short description about it and to view the profit and loss shape. This small chart shows how the stock price, represented by the X axis, affects the profit and loss, represented by the Y axis.
2. Choose a stock
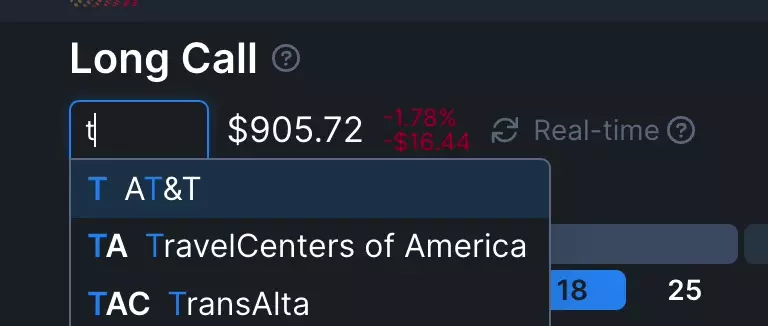
To choose a stock, type the symbol or company name to search it. Only stocks that have options are shown. Once selected, you will see the current price of the stock and the available options. (If you are searching for a futures option, add a slash before the symbol, such as /ES)
3. Select an option
Slide the expiration selector to view all expiration dates. Click an expiration day to select it. For complex strategies, you can also add another expiration.
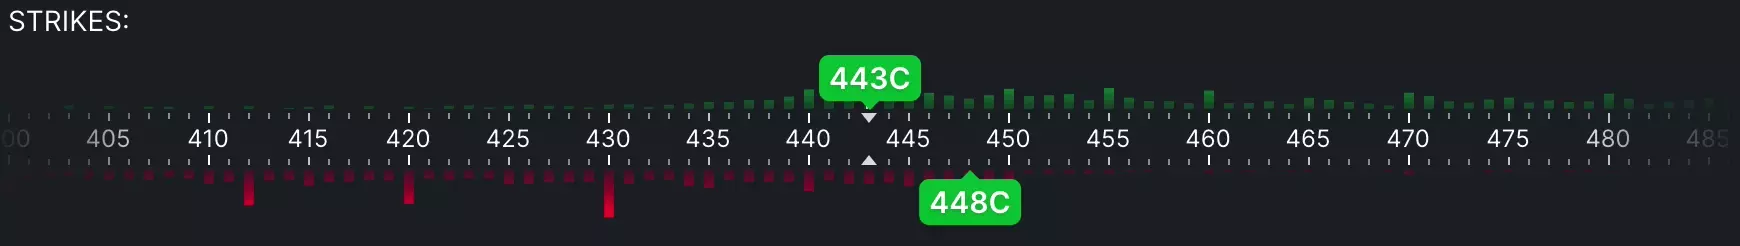
Similarly, slide the strike selector to view all available strikes. Drag an option to change it's strike.
Calls are green and puts are red. Options on top are long (bought), and options on the bottom are short (sold).
Premium members will see bars above and below each price, which show the volume of calls (green) and puts (red) at each strike.
Hold shift while dragging the strike slider to move all strikes at once. For some strategies like iron condors or butterflies, hold shift while dragging an individual option to move the opposing option in the opposite direction.
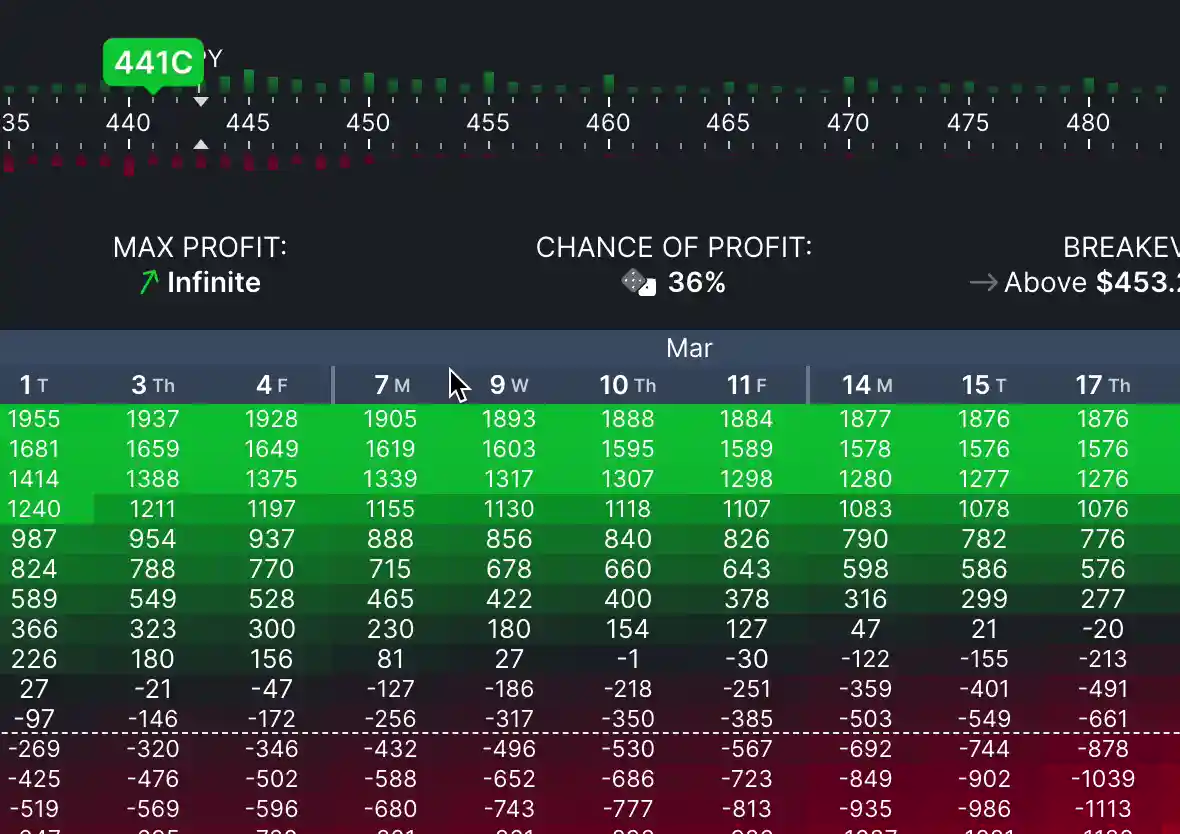
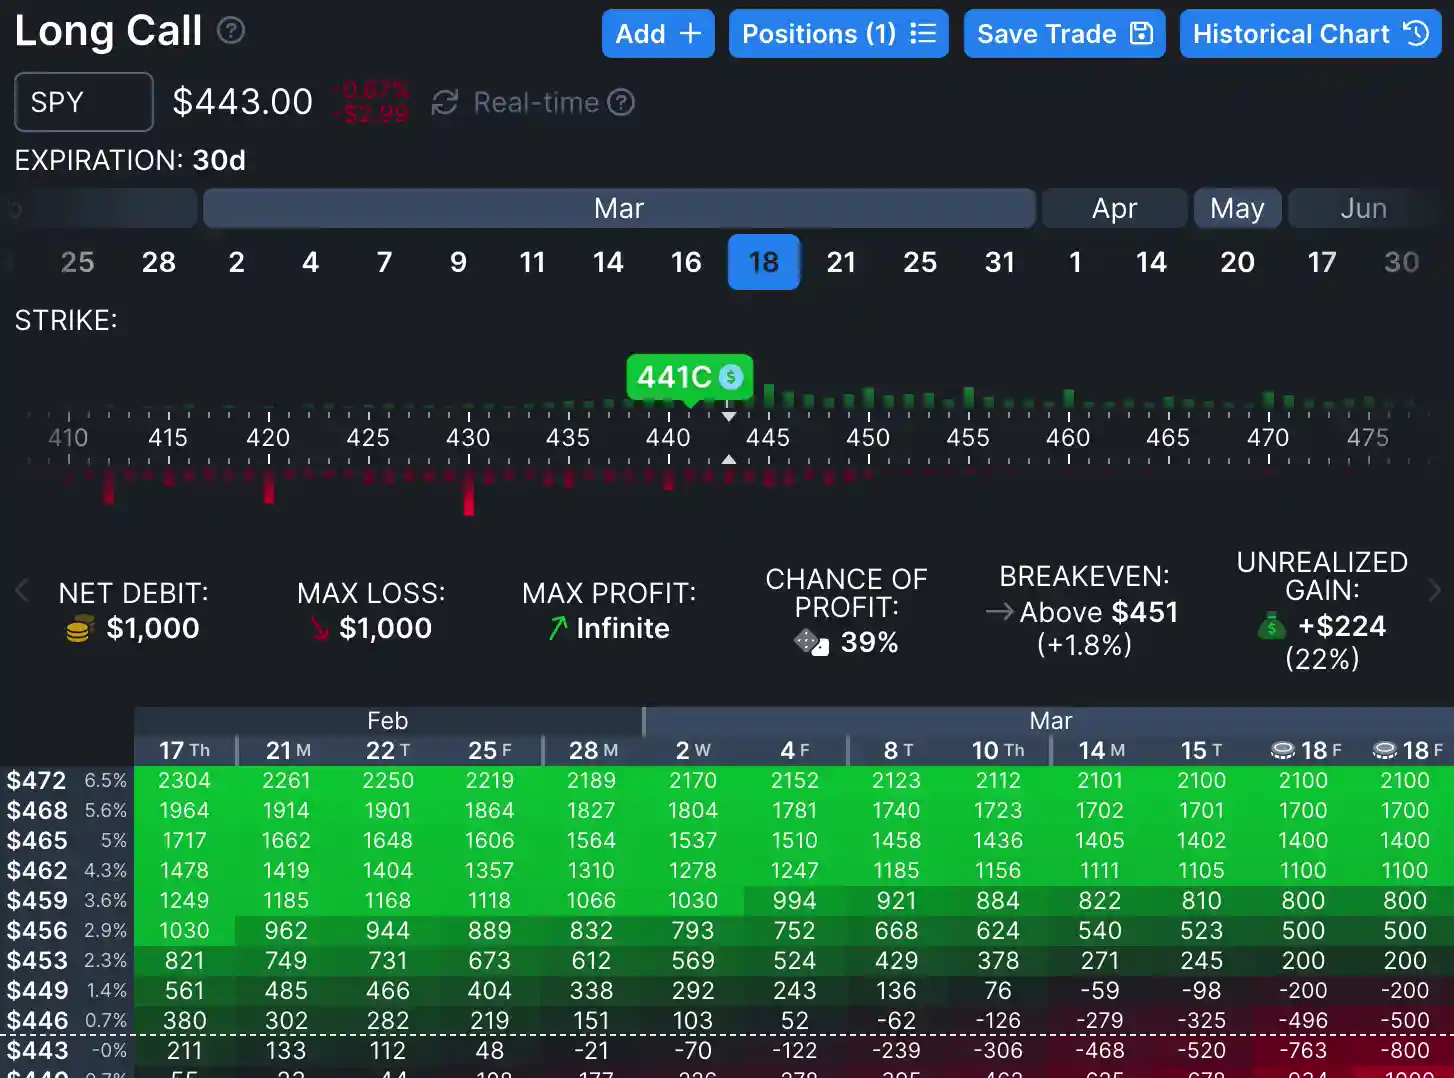
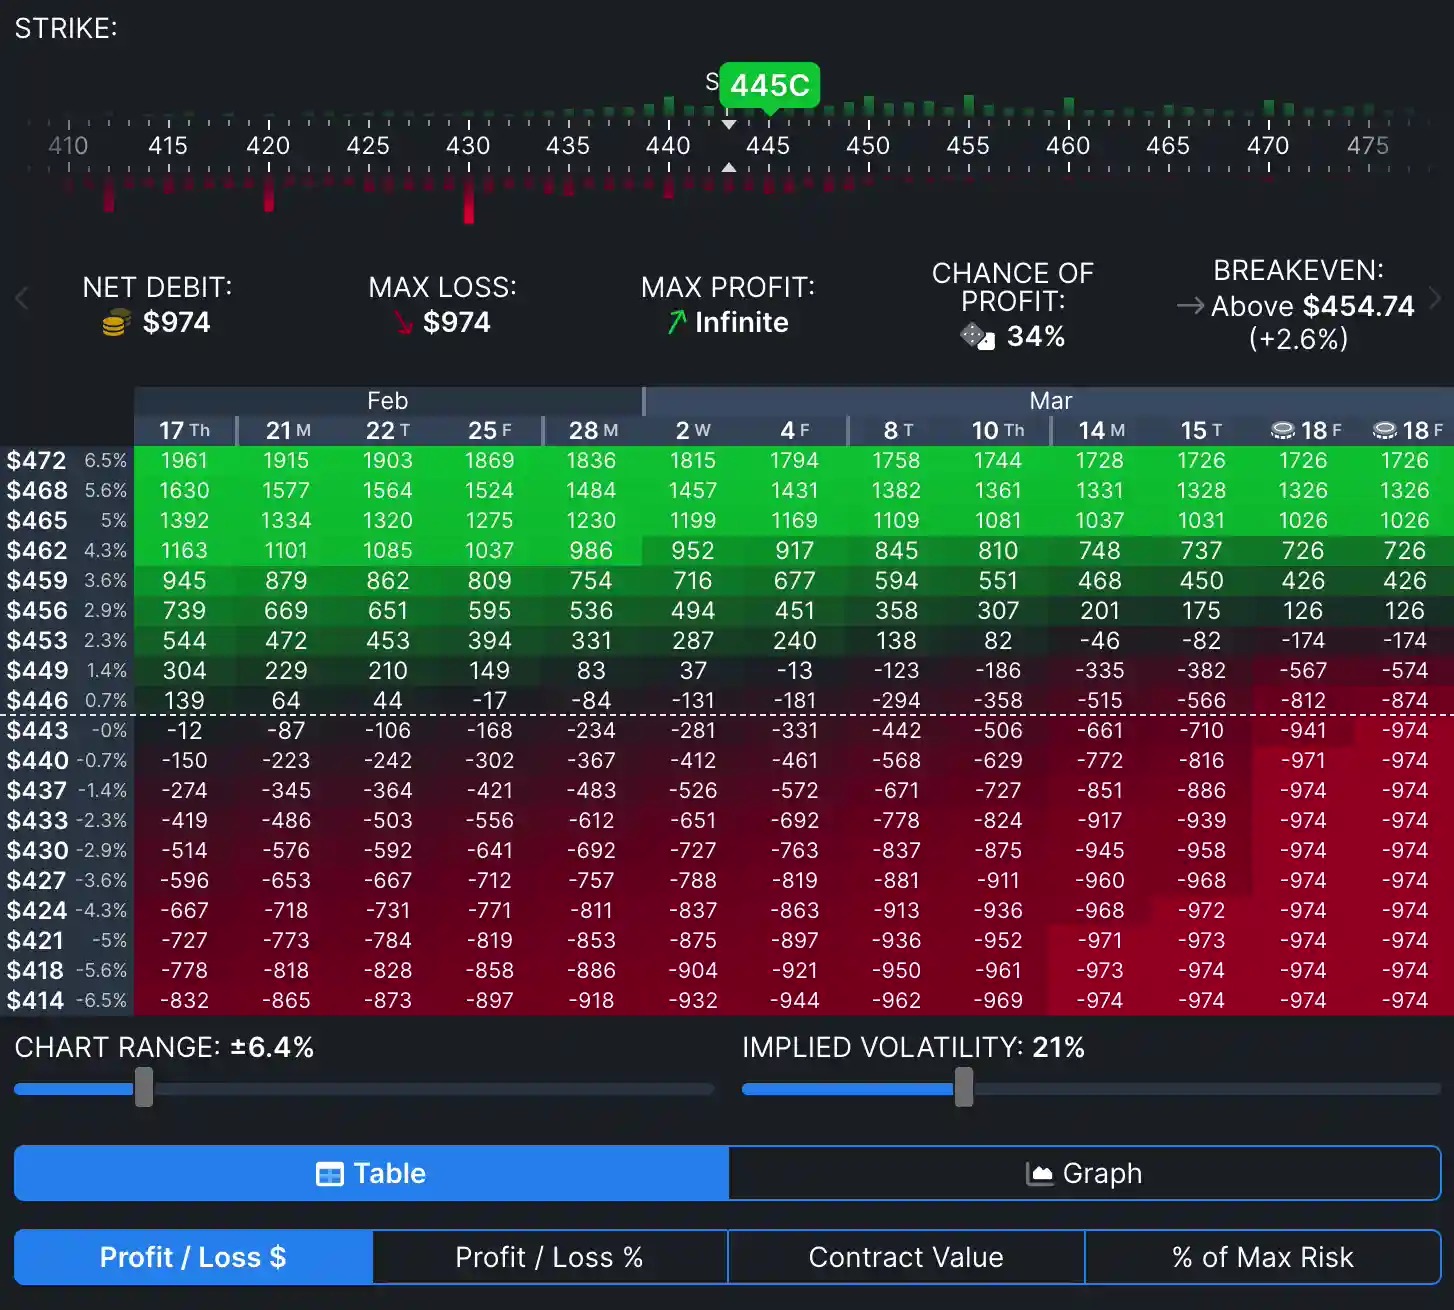
4. View key stats

Now that your option or strategy is selected, you can view key information including the net debit (or credit), the maximum loss and profit, the breakeven prices, and the chance of profit.
- Net Debit/Credit: The cost of the trade, or the credit received for the trade. Buying options requires a debit, while selling options gives you a credit.
- Max Loss/Max Profit: The maximum potential loss or profit of this trade at expiration. Note that this does not account for assignment risk, dividend risk, etc.
- Breakeven: This is where the stock must be at expiration to make any profit at all.
- Chance of Profit: Only visible to premium members, shows the chance of profit based on the implied move.
- Greeks: Swiping to the second page of stats shows the net option greeks, which are the combined greeks for all options in your strategy. Refer to any basic options tutorial to learn more about the greeks.
- Realized and Unrealized Gain/Loss: This statistic is hidden for new strategies, but if prices have changed since opening your strategy, we will show the unrealized profit or loss achieved so far. If any positions have been closed or expired, we will also show the realized profit or loss.
5. Using the profit/loss table
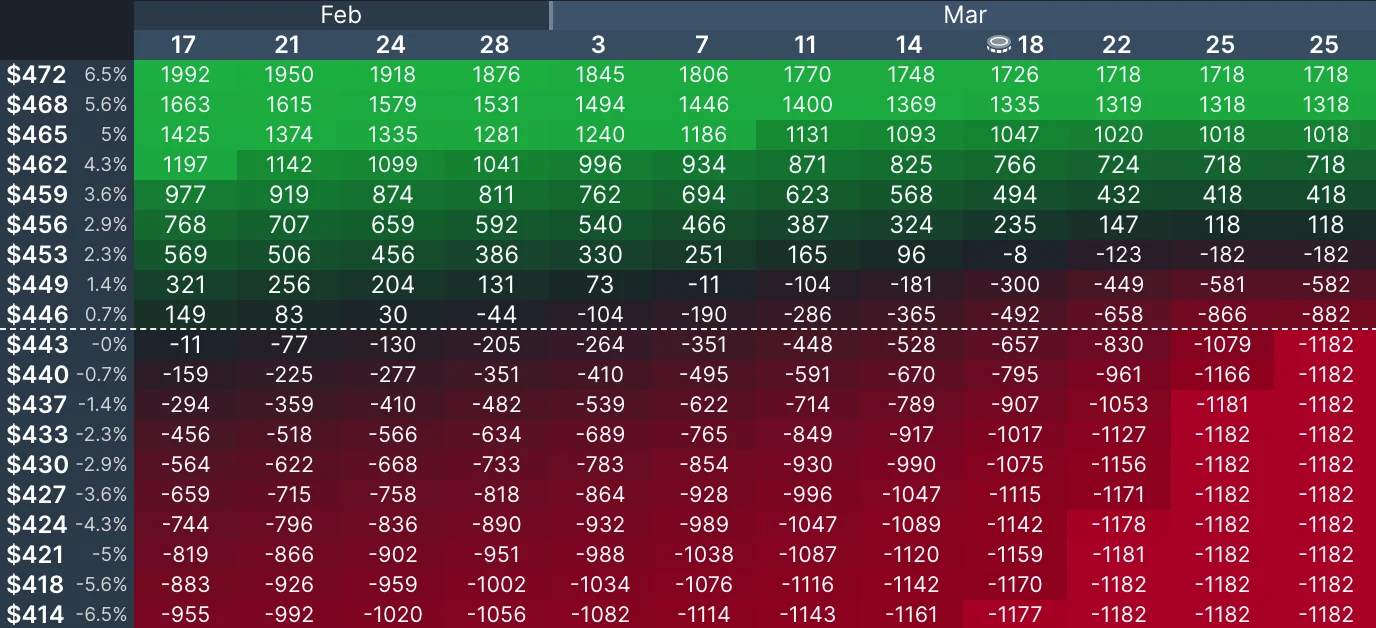
The table shows the expected profit or loss of your option(s). The rows are the potential prices that the underlying stock could be, and the columns are various dates in the future. For example, in the above image, you can see how the call will have an estimated profit of $871 profit if the stock hits $462 on March 11th.
Use the "Chart Range" slider to zoom in or out on the table. The buttons below the table allow you to change what values are displayed. It defaults to the profit and loss in dollars, but you can also select the percent change, percent of risk, or actual value of the contract(s).
Premium members will also see icons on the chart which indicate important dates. The above chart has an icon on the 18th which indicates that the stock has an ex-dividend date then. We also show icons for upcoming earnings and splits.
6. Using the profit/loss chart
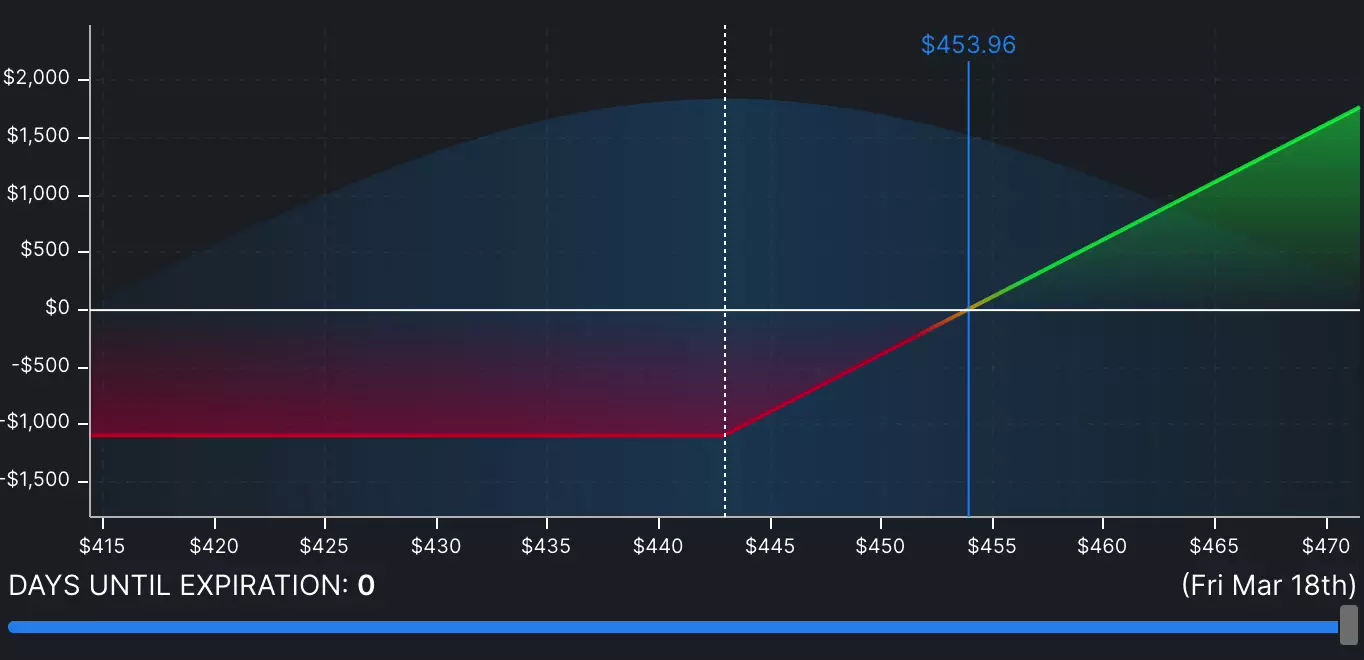
The chart is a similar method of viewing the profit and loss, but it only shows one day at a time. Use it if you want to get a closer look at the various potential prices for a day. The X axis is the potential price of the underlying, and the Y axis is the profit/loss at that price. Drag the "Days Until Expiration" slider to change the day, and move your mouse over the graph to show the exact profit/loss at a point. The blue line represents the breakeven price.
Premium members will also see a blue probability distribution overlay, which indicates the probability of where the stock will be on the day selected. The two percentages with arrows indicate the chance of the stock price being less or greater than the price you are hovering over.
7. Adjusting IV
IV, or implied volatility, has a big impact on the price of options. It represents the market's (i.e. other traders) forecast in movement of the underlying stock. When IV is high, the price of options are higher because the stock has a higher likelihood of moving. The calculator assumes the IV is constant, but in reality it will likely change. Use the IV slider to understand how changes in the IV will affect your trade. For example, a long call or put will decrease in value if IV decreases (known as IV crush), which happens after earnings. This means you can potentially lose money even if you predicted the stock direction correctly! We highly recommend that you fully understand implied volatility (what it is, why it changes, and how it affects options) before trading options. Since IV changes due to real-world supply and demand, it isn't something calculators can predict.
8. Adjusting the options
After selecting an option, you can make changes such as adjusting the quantity, type, or cost-basis. Click on the option to see additional details and make these changes.
To edit the price, click the price and input a custom price. By default the, current price is used, but you can input a custom price so that the calculations match the actual trade you made. This is very important to do if you are trying to build an existing trade (that you actually made via your broker). Options that have a custom cost-basis will have a blue dollar icon next to them.
Be aware of the "Exclude" or "Include" buttons on this menu. This allows you to easily exclude an option from the calculations. If you want to see how adding or removing options affects your strategy, it is easier to simply exclude/include them rather than actually remove them and have to add them back. Any excluded options will have a crossed out eye icon and will be darker than open options.
This menu will also show various warnings about the option, if it has any. Warnings are shown for options that have very low volume or open interest, or a wide bid/ask spread (meaning the the bid and ask prices are very far away from each other). All of these are reasons to consider not trading the option, as you may have difficulty entering or exiting the trade at a fair price.
9. Viewing price history
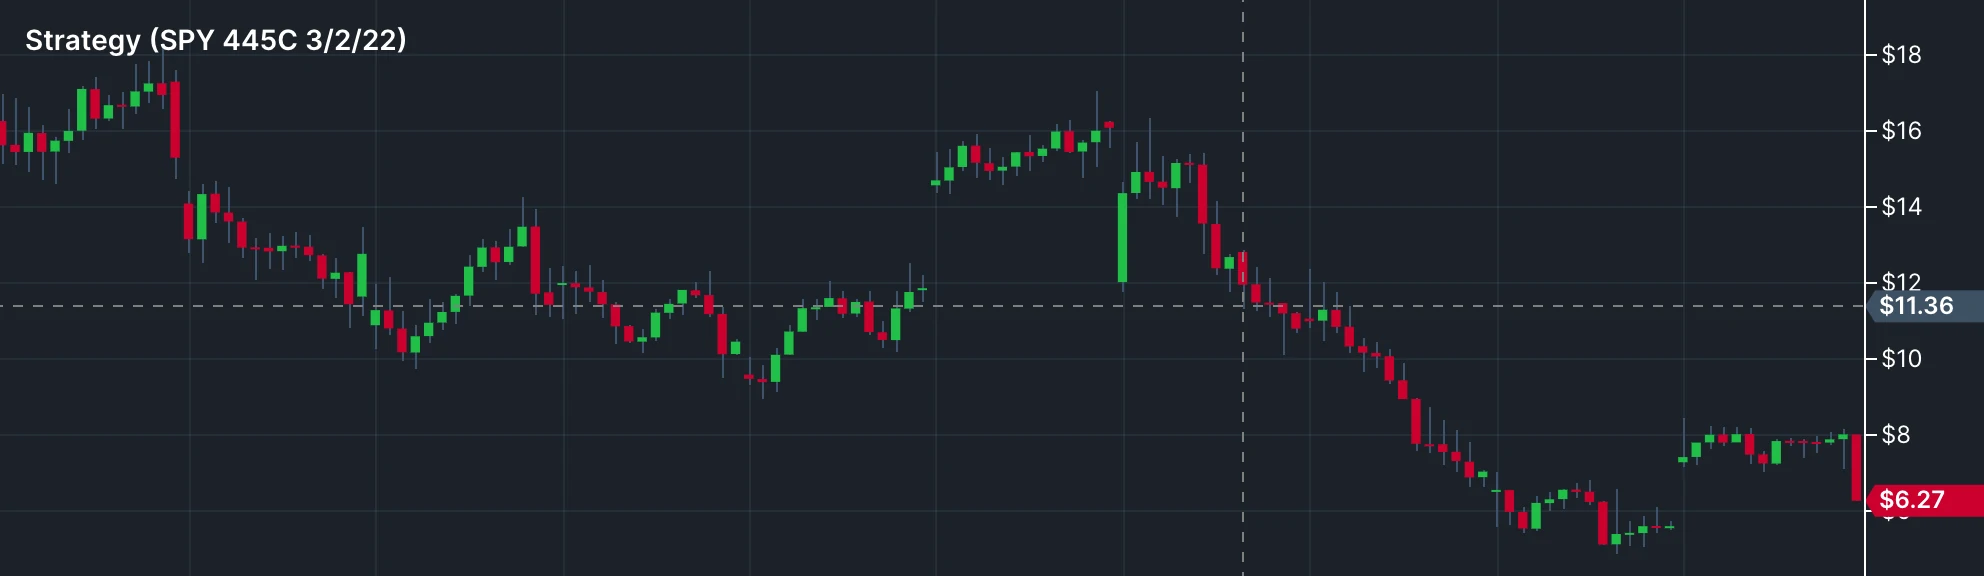
While the table and graph show predicted future prices, you may be wondering how an option has performed in the past. To see the historical price of the current strategy, click the history button in the top right.
Note: The price history shown is the price of the option contract itself, not the profit or loss (as you didn't have any position or cost-basis in the past). We also show the price as the smallest unit possible, meaning if you have an option with a quantity of 10, we show the price as a quantity of 1. This is to help you when placing orders, since you place a limit order for the price of a single option contract, not the total price. Additionally, candlestick charts can only be shown for single-option strategies. (Since the high/low point of each leg may not be at the same time with multi-leg strategies)
10. Saving and sharing trades
Click the save button in the top right to save the trade. You are also given the option to share the link. Saved trades will show on the saved tab and allow you to track the profit and loss of your trade over time. You can also simply copy the URL from your browser to share a trade, but it won't be added to your account unless you save it through the save dialog.
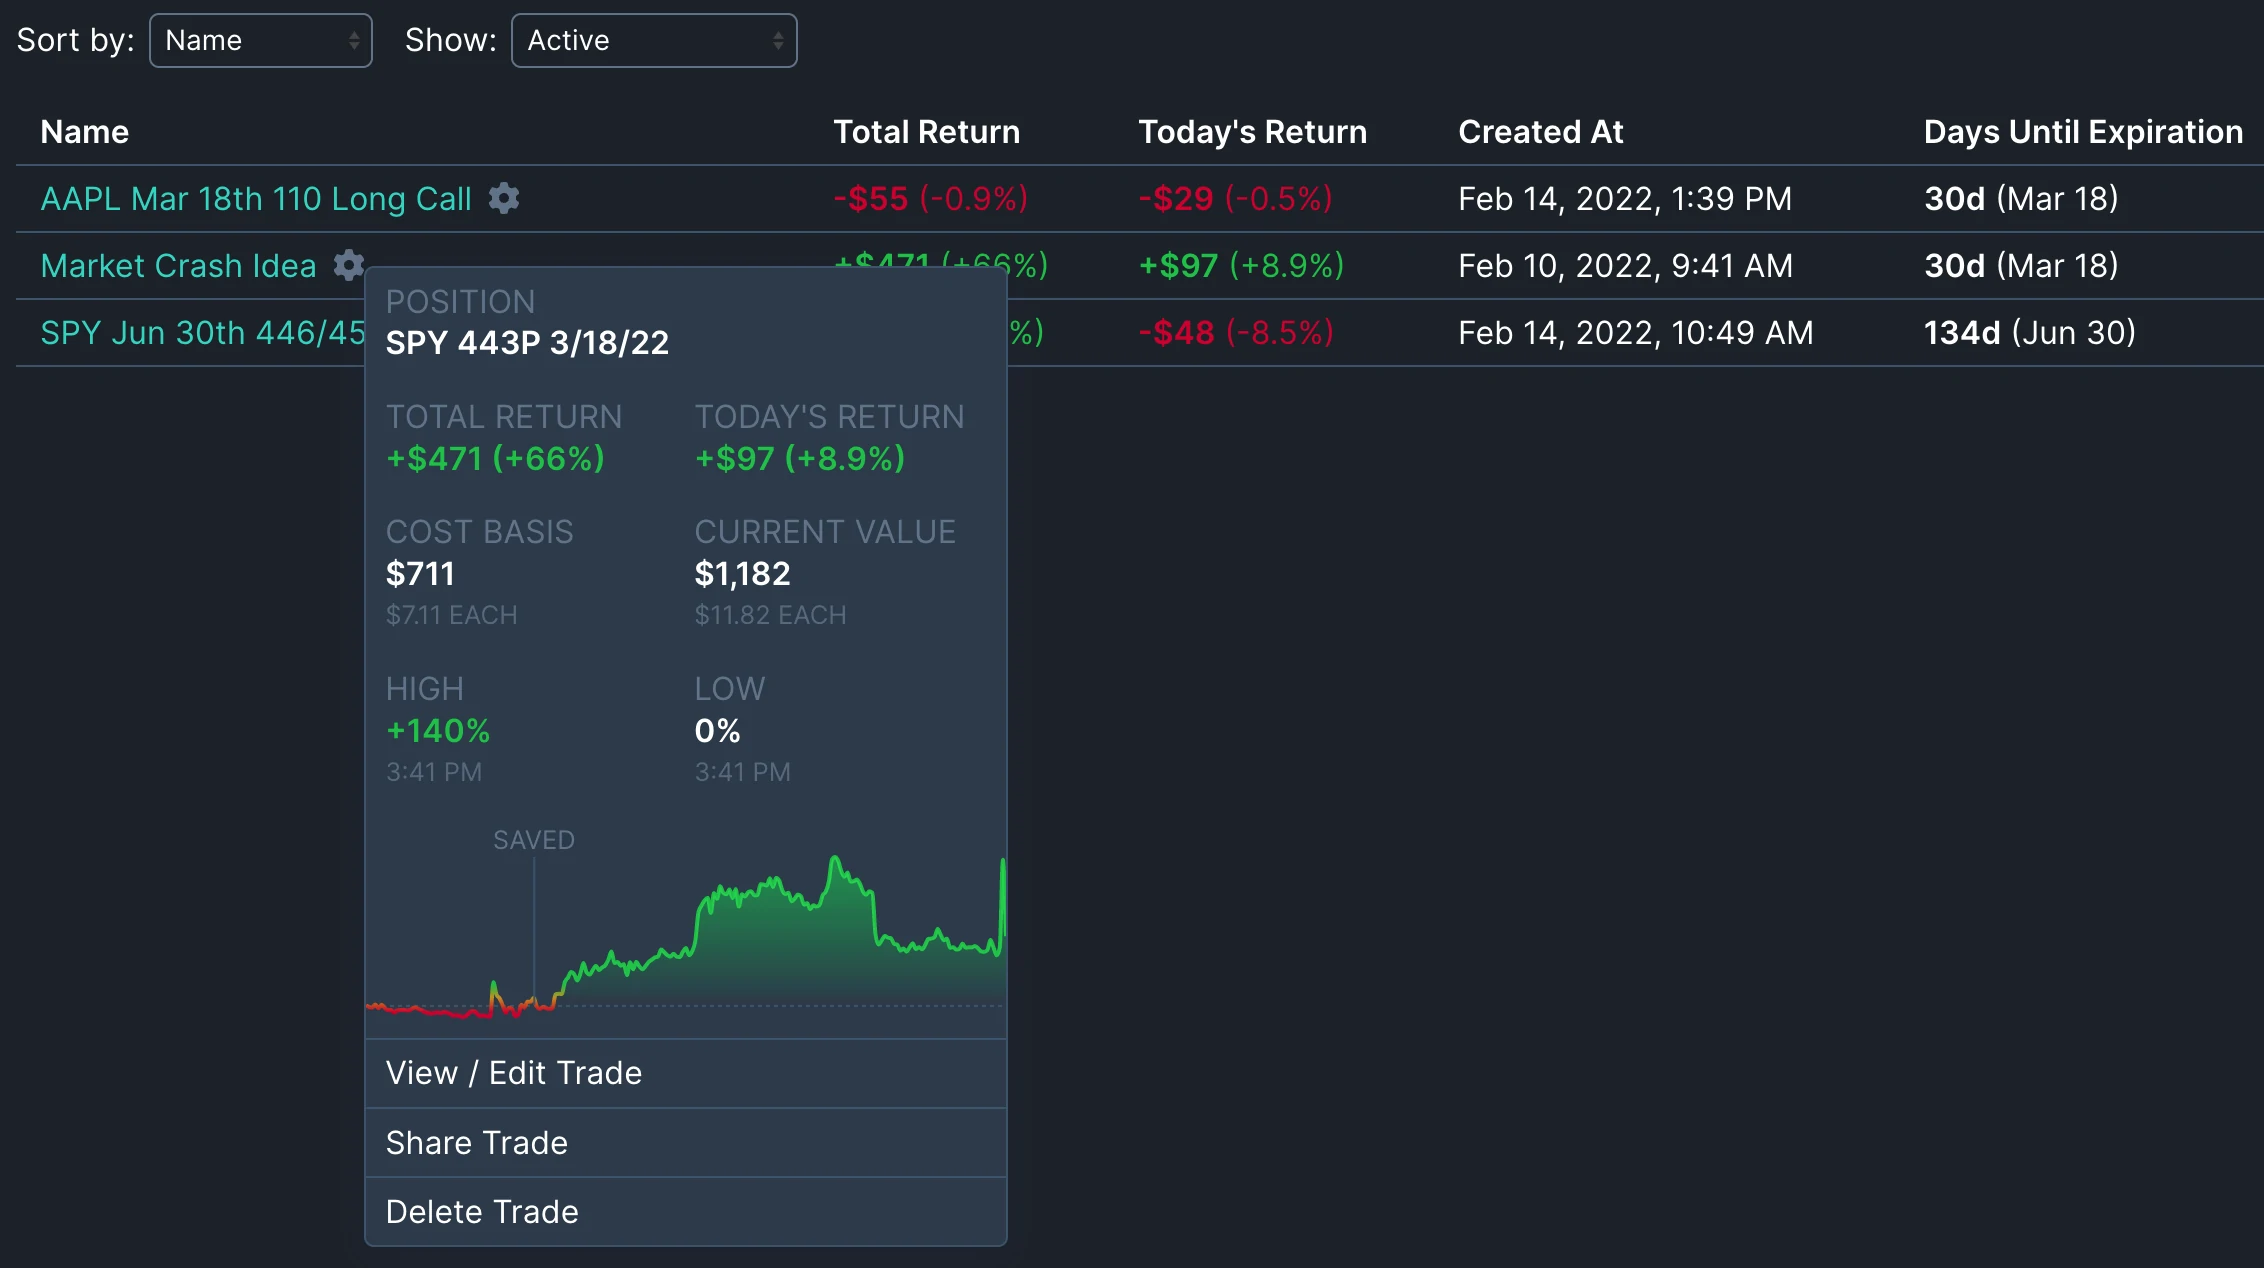
Premium members will also see a graph of the strategy performance so far, as well as the maximum profit and loss that has been reached.
11. Editing and rolling trades
You can open your saved trades at any time to view or edit them. If your trade has made a profit or loss, we will show that as the "Unrealized Profit/Loss" in the stats area.
If you make any changes to the positions in your trade, make sure to save the trade again. You can choose to overwrite the previous version, or save it as a new trade.
You can also close options the via option menu (by clicking on the option). Closing an option will lock in the profit (or loss) achieved so far. If you bought an option, this is equivalent to selling it to close. If you sold an option, this is equivalent to buying it to close. Closed trades will appear darker and have a blue check mark. After closing the option, you can click the closing price (or opening price) to edit them if needed.
"Rolling" refers to closing an option and opening a new one in order to try to fix or repair an option strategy. To roll an option in OptionStrat, just close the existing option as explained above, and then add a new option to the strategy from the add menu.
It is important to note that after you save your changes, any closed or expired positions will be removed from the interface. This does not mean they are gone from your strategy, they still are accounted for in your realized gain, they are just removed from the main interface to reduce clutter (imagine the mess if it was filled with tons of old options that you have rolled). Instead, you can find your old positions by clicking the positions button in the top right. This dialog shows all of your open and closed positions.
12. Comparing trades
Lastly, when you are making edits to a saved trade, a toggle button will appear allowing you to switch between the previous and new strategy. This allows you to see the difference between your new trade and the old trade.
Additionally, the strategy graph will have a gray line which represents the graph of the old trade. This makes it easy to see how the profit/loss graph has changed due to your edits.
Once you save the trade again, the toggle will be removed unless you make another edit.
That's all for now, happy trading! Please contact us if you have any questions.